Email
Unemployment Data Update: March through November 5, 2020
| From | Center for Jobs and the Economy <[email protected]> |
| Subject | Unemployment Data Update: March through November 5, 2020 |
| Date | November 5, 2020 10:30 PM |
Links have been removed from this email. Learn more in the FAQ.
Links have been removed from this email. Learn more in the FAQ.
Web Version [link removed] | Update Preferences [link removed] [link removed] Unemployment Data Update: March through November 5, 2020 Unemployment Insurance Claims
Initial claims were largely stable both in California and the rest of the country in the week of October 31. Initial claims (not seasonally adjusted) in the regular program were up only 0.2% in the state, while down 0.9% for the country as a whole. Initial claims under PUA were up 19.7% for California, but this bump contributed to a rise of only 1.1% for the nation.
Combined, total initial claims for California were up 3.0% and 0.3% for the US. Total claims have not shown substantial change since the week of August 20 in the rest of the country. The level of claims essentially have remained level in California over the past 3 weeks, but at a higher overall level.
Backlog
In their latest reports [[link removed]], EDD shows substantially better progress in dealing with the continuing claims backlog. At the rate of the prior week, it would take well over a year to eliminate the initial claims backlog. For the continuing claims backlog, clearance would take 81 days if continued at the prior week rate.
County Tier Status
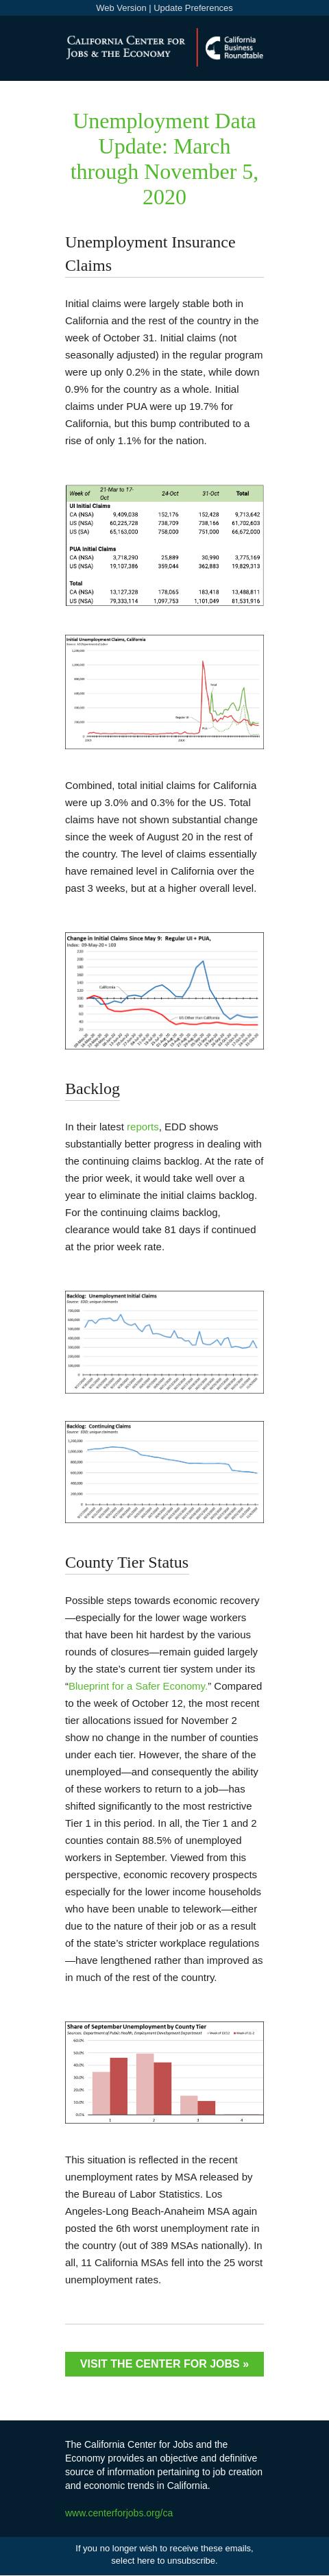
Possible steps towards economic recovery—especially for the lower wage workers that have been hit hardest by the various rounds of closures—remain guided largely by the state’s current tier system under its “ Blueprint for a Safer Economy. [[link removed]]” Compared to the week of October 12, the most recent tier allocations issued for November 2 show no change in the number of counties under each tier. However, the share of the unemployed—and consequently the ability of these workers to return to a job—has shifted significantly to the most restrictive Tier 1 in this period. In all, the Tier 1 and 2 counties contain 88.5% of unemployed workers in September. Viewed from this perspective, economic recovery prospects especially for the lower income households who have been unable to telework—either due to the nature of their job or as a result of the state’s stricter workplace regulations—have lengthened rather than improved as in much of the rest of the country.
This situation is reflected in the recent unemployment rates by MSA released by the Bureau of Labor Statistics. Los Angeles-Long Beach-Anaheim MSA again posted the 6th worst unemployment rate in the country (out of 389 MSAs nationally). In all, 11 California MSAs fell into the 25 worst unemployment rates.
Visit The Center For Jobs » [[link removed]] The California Center for Jobs and the Economy provides an objective and definitive source of information pertaining to job creation and economic trends in California. [[link removed]] Contact 1301 I Street Sacramento, CA 95814 916.553.4093 If you no longer wish to receive these emails, select here to unsubscribe. [link removed]
Initial claims were largely stable both in California and the rest of the country in the week of October 31. Initial claims (not seasonally adjusted) in the regular program were up only 0.2% in the state, while down 0.9% for the country as a whole. Initial claims under PUA were up 19.7% for California, but this bump contributed to a rise of only 1.1% for the nation.
Combined, total initial claims for California were up 3.0% and 0.3% for the US. Total claims have not shown substantial change since the week of August 20 in the rest of the country. The level of claims essentially have remained level in California over the past 3 weeks, but at a higher overall level.
Backlog
In their latest reports [[link removed]], EDD shows substantially better progress in dealing with the continuing claims backlog. At the rate of the prior week, it would take well over a year to eliminate the initial claims backlog. For the continuing claims backlog, clearance would take 81 days if continued at the prior week rate.
County Tier Status
Possible steps towards economic recovery—especially for the lower wage workers that have been hit hardest by the various rounds of closures—remain guided largely by the state’s current tier system under its “ Blueprint for a Safer Economy. [[link removed]]” Compared to the week of October 12, the most recent tier allocations issued for November 2 show no change in the number of counties under each tier. However, the share of the unemployed—and consequently the ability of these workers to return to a job—has shifted significantly to the most restrictive Tier 1 in this period. In all, the Tier 1 and 2 counties contain 88.5% of unemployed workers in September. Viewed from this perspective, economic recovery prospects especially for the lower income households who have been unable to telework—either due to the nature of their job or as a result of the state’s stricter workplace regulations—have lengthened rather than improved as in much of the rest of the country.
This situation is reflected in the recent unemployment rates by MSA released by the Bureau of Labor Statistics. Los Angeles-Long Beach-Anaheim MSA again posted the 6th worst unemployment rate in the country (out of 389 MSAs nationally). In all, 11 California MSAs fell into the 25 worst unemployment rates.
Visit The Center For Jobs » [[link removed]] The California Center for Jobs and the Economy provides an objective and definitive source of information pertaining to job creation and economic trends in California. [[link removed]] Contact 1301 I Street Sacramento, CA 95814 916.553.4093 If you no longer wish to receive these emails, select here to unsubscribe. [link removed]
Message Analysis
- Sender: California Center for Jobs and the Economy
- Political Party: n/a
- Country: United States
- State/Locality: California
- Office: n/a
-
Email Providers:
- Campaign Monitor