| From | Center for Jobs and the Economy <[email protected]> |
| Subject | California Trade Report for January 2023 |
| Date | March 8, 2023 11:30 PM |
Links have been removed from this email. Learn more in the FAQ.
Links have been removed from this email. Learn more in the FAQ.
Web Version [link removed] | Update Preferences [link removed] [link removed] California Trade Report
for January 2023
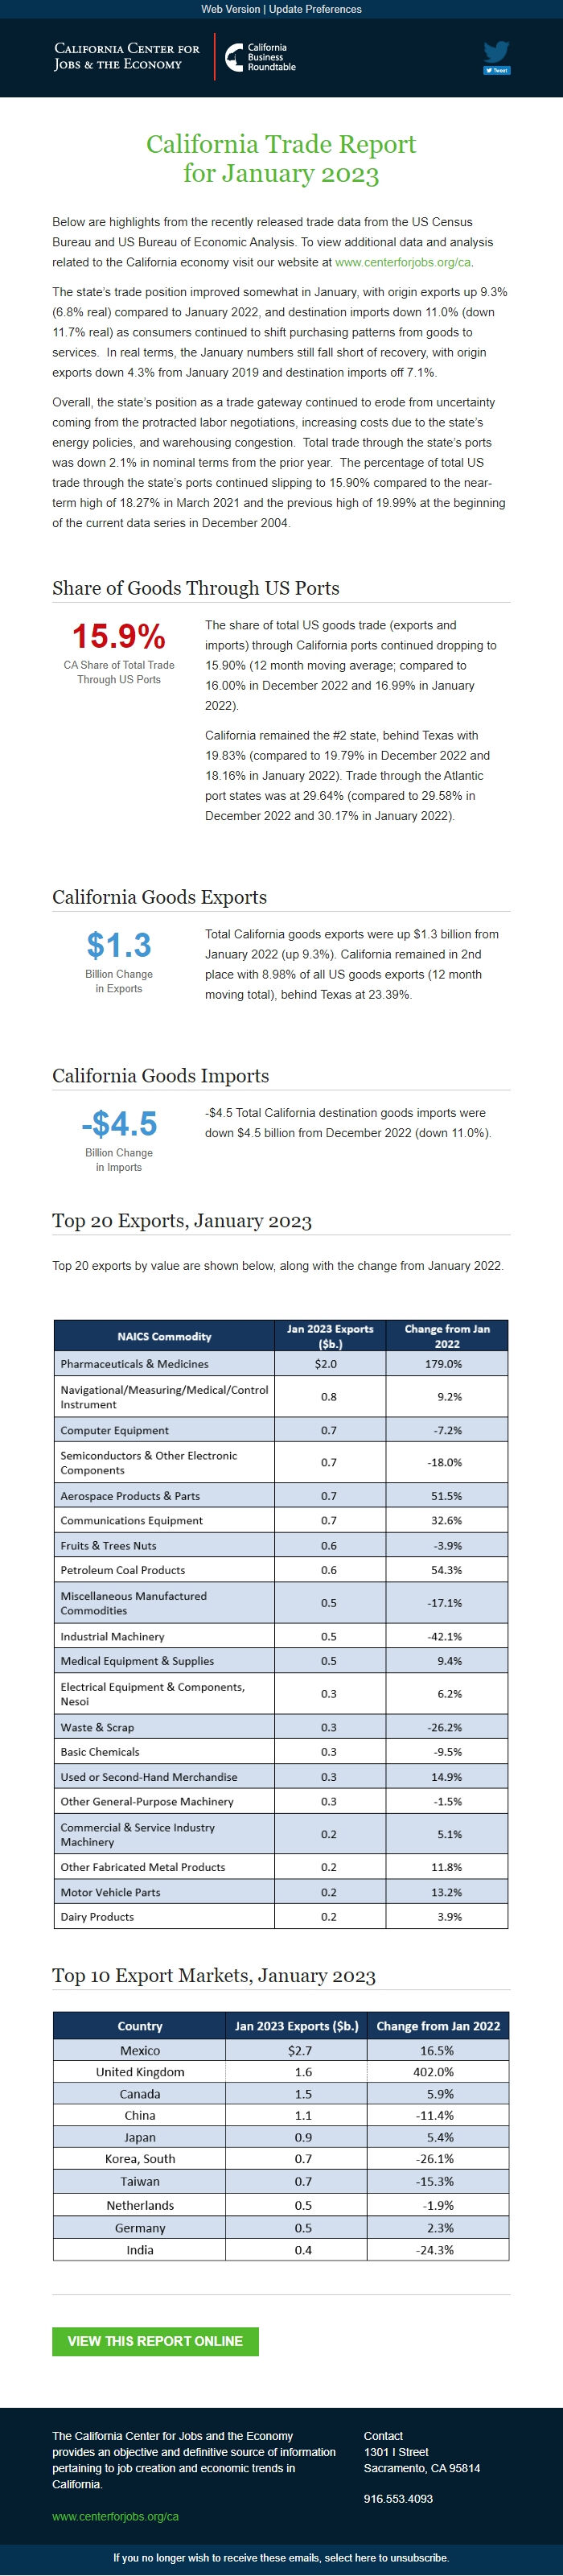
Below are highlights from the recently released trade data from the US Census Bureau and US Bureau of Economic Analysis. To view additional data and analysis related to the California economy visit our website at [[link removed]].
The state’s trade position improved somewhat in January, with origin exports up 9.3% (6.8% real) compared to January 2022, and destination imports down 11.0% (down 11.7% real) as consumers continued to shift purchasing patterns from goods to services. In real terms, the January numbers still fall short of recovery, with origin exports down 4.3% from January 2019 and destination imports off 7.1%.
Overall, the state’s position as a trade gateway continued to erode from uncertainty coming from the protracted labor negotiations, increasing costs due to the state’s energy policies, and warehousing congestion. Total trade through the state’s ports was down 2.1% in nominal terms from the prior year. The percentage of total US trade through the state’s ports continued slipping to 15.90% compared to the near-term high of 18.27% in March 2021 and the previous high of 19.99% at the beginning of the current data series in December 2004.
Share of Goods Through US Ports 15.9% CA Share of Total Trade
Through US Ports
The share of total US goods trade (exports and imports) through California ports continued dropping to 15.90% (12 month moving average; compared to 16.00% in December 2022 and 16.99% in January 2022).
California remained the #2 state, behind Texas with 19.83% (compared to 19.79% in December 2022 and 18.16% in January 2022). Trade through the Atlantic port states was at 29.64% (compared to 29.58% in December 2022 and 30.17% in January 2022).
California Goods Exports $1.3 Billion Change
in Exports
Total California goods exports were up $1.3 billion from January 2022 (up 9.3%). California remained in 2nd place with 8.98% of all US goods exports (12 month moving total), behind Texas at 23.39%.
California Goods Imports -$4.5 Billion Change
in Imports
-$4.5 Total California destination goods imports were down $4.5 billion from December 2022 (down 11.0%).
Top 20 Exports, January 2023
Top 20 exports by value are shown below, along with the change from January 2022.
Top 10 Export Markets, January 2023 View This Report Online [[link removed]] The California Center for Jobs and the Economy provides an objective and definitive source of information pertaining to job creation and economic trends in California. [[link removed]] Contact 1301 I Street Sacramento, CA 95814 916.553.4093 If you no longer wish to receive these emails, select here to unsubscribe. [link removed]
for January 2023
Below are highlights from the recently released trade data from the US Census Bureau and US Bureau of Economic Analysis. To view additional data and analysis related to the California economy visit our website at [[link removed]].
The state’s trade position improved somewhat in January, with origin exports up 9.3% (6.8% real) compared to January 2022, and destination imports down 11.0% (down 11.7% real) as consumers continued to shift purchasing patterns from goods to services. In real terms, the January numbers still fall short of recovery, with origin exports down 4.3% from January 2019 and destination imports off 7.1%.
Overall, the state’s position as a trade gateway continued to erode from uncertainty coming from the protracted labor negotiations, increasing costs due to the state’s energy policies, and warehousing congestion. Total trade through the state’s ports was down 2.1% in nominal terms from the prior year. The percentage of total US trade through the state’s ports continued slipping to 15.90% compared to the near-term high of 18.27% in March 2021 and the previous high of 19.99% at the beginning of the current data series in December 2004.
Share of Goods Through US Ports 15.9% CA Share of Total Trade
Through US Ports
The share of total US goods trade (exports and imports) through California ports continued dropping to 15.90% (12 month moving average; compared to 16.00% in December 2022 and 16.99% in January 2022).
California remained the #2 state, behind Texas with 19.83% (compared to 19.79% in December 2022 and 18.16% in January 2022). Trade through the Atlantic port states was at 29.64% (compared to 29.58% in December 2022 and 30.17% in January 2022).
California Goods Exports $1.3 Billion Change
in Exports
Total California goods exports were up $1.3 billion from January 2022 (up 9.3%). California remained in 2nd place with 8.98% of all US goods exports (12 month moving total), behind Texas at 23.39%.
California Goods Imports -$4.5 Billion Change
in Imports
-$4.5 Total California destination goods imports were down $4.5 billion from December 2022 (down 11.0%).
Top 20 Exports, January 2023
Top 20 exports by value are shown below, along with the change from January 2022.
Top 10 Export Markets, January 2023 View This Report Online [[link removed]] The California Center for Jobs and the Economy provides an objective and definitive source of information pertaining to job creation and economic trends in California. [[link removed]] Contact 1301 I Street Sacramento, CA 95814 916.553.4093 If you no longer wish to receive these emails, select here to unsubscribe. [link removed]
Message Analysis
- Sender: California Center for Jobs and the Economy
- Political Party: n/a
- Country: United States
- State/Locality: California
- Office: n/a
-
Email Providers:
- Campaign Monitor