| From | Center for Jobs and the Economy <[email protected]> |
| Subject | California Energy Price Data for February 2023 |
| Date | March 8, 2023 5:00 PM |
Links have been removed from this email. Learn more in the FAQ.
Links have been removed from this email. Learn more in the FAQ.
Web Version [link removed] | Update Preferences [link removed] [link removed] California Energy Price Data
February 2023
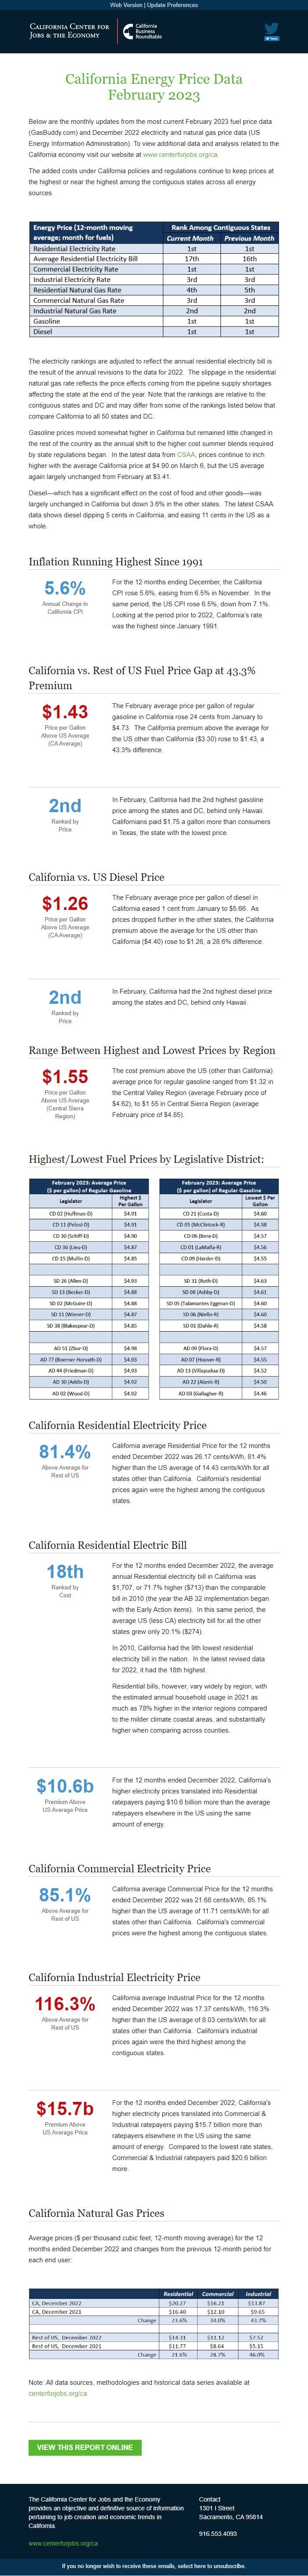
Below are the monthly updates from the most current February 2023 fuel price data (GasBuddy.com) and December 2022 electricity and natural gas price data (US Energy Information Administration). To view additional data and analysis related to the California economy visit our website at [[link removed]].
The added costs under California policies and regulations continue to keep prices at the highest or near the highest among the contiguous states across all energy sources.
The electricity rankings are adjusted to reflect the annual residential electricity bill is the result of the annual revisions to the data for 2022. The slippage in the residential natural gas rate reflects the price effects coming from the pipeline supply shortages affecting the state at the end of the year. Note that the rankings are relative to the contiguous states and DC and may differ from some of the rankings listed below that compare California to all 50 states and DC.
Gasoline prices moved somewhat higher in California but remained little changed in the rest of the country as the annual shift to the higher cost summer blends required by state regulations began. In the latest data from CSAA [[link removed]], prices continue to inch higher with the average California price at $4.90 on March 6, but the US average again largely unchanged from February at $3.41.
Diesel—which has a significant effect on the cost of food and other goods—was largely unchanged in California but down 3.6% in the other states. The latest CSAA data shows diesel dipping 5 cents in California, and easing 11 cents in the US as a whole.
Inflation Running Highest Since 1991 5.6% Annual Change in
California CPI
For the 12 months ending December, the California CPI rose 5.6%, easing from 6.5% in November. In the same period, the US CPI rose 6.5%, down from 7.1%. Looking at the period prior to 2022, California’s rate was the highest since January 1991.
California vs. Rest of US Fuel Price Gap at 43.3% Premium $1.43 Price per Gallon
Above US Average
(CA Average)
The February average price per gallon of regular gasoline in California rose 24 cents from January to $4.73. The California premium above the average for the US other than California ($3.30) rose to $1.43, a 43.3% difference.
2nd Ranked by
Price
In February, California had the 2nd highest gasoline price among the states and DC, behind only Hawaii. Californians paid $1.75 a gallon more than consumers in Texas, the state with the lowest price.
California vs. US Diesel Price $1.26 Price per Gallon
Above US Average
(CA Average)
The February average price per gallon of diesel in California eased 1 cent from January to $5.66. As prices dropped further in the other states, the California premium above the average for the US other than California ($4.40) rose to $1.26, a 28.6% difference.
2nd Ranked by
Price
In February, California had the 2nd highest diesel price among the states and DC, behind only Hawaii.
Range Between Highest and Lowest Prices by Region $1.55 Price per Gallon
Above US Average
(Central Sierra
Region)
The cost premium above the US (other than California) average price for regular gasoline ranged from $1.32 in the Central Valley Region (average February price of $4.62), to $1.55 in Central Sierra Region (average February price of $4.85).
Highest/Lowest Fuel Prices by Legislative District: California Residential Electricity Price 81.4% Above Average for
Rest of US
California average Residential Price for the 12 months ended December 2022 was 26.17 cents/kWh, 81.4% higher than the US average of 14.43 cents/kWh for all states other than California. California's residential prices again were the highest among the contiguous states.
California Residential Electric Bill 18th Ranked by
Cost
For the 12 months ended December 2022, the average annual Residential electricity bill in California was $1,707, or 71.7% higher ($713) than the comparable bill in 2010 (the year the AB 32 implementation began with the Early Action items). In this same period, the average US (less CA) electricity bill for all the other states grew only 20.1% ($274).
In 2010, California had the 9th lowest residential electricity bill in the nation. In the latest revised data for 2022, it had the 18th highest.
Residential bills, however, vary widely by region, with the estimated annual household usage in 2021 as much as 78% higher in the interior regions compared to the milder climate coastal areas, and substantially higher when comparing across counties.
$10.6b Premium Above
US Average Price
For the 12 months ended December 2022, California's higher electricity prices translated into Residential ratepayers paying $10.6 billion more than the average ratepayers elsewhere in the US using the same amount of energy.
California Commercial Electricity Price 85.1% Above Average for
Rest of US
California average Commercial Price for the 12 months ended December 2022 was 21.68 cents/kWh, 85.1% higher than the US average of 11.71 cents/kWh for all states other than California. California's commercial prices were the highest among the contiguous states.
California Industrial Electricity Price 116.3% Above Average for
Rest of US
California average Industrial Price for the 12 months ended December 2022 was 17.37 cents/kWh, 116.3% higher than the US average of 8.03 cents/kWh for all states other than California. California's industrial prices again were the third highest among the contiguous states.
$15.7b Premium Above
US Average Price
For the 12 months ended December 2022, California's higher electricity prices translated into Commercial & Industrial ratepayers paying $15.7 billion more than ratepayers elsewhere in the US using the same amount of energy. Compared to the lowest rate states, Commercial & Industrial ratepayers paid $20.6 billion more.
California Natural Gas Prices
Average prices ($ per thousand cubic feet; 12-month moving average) for the 12 months ended December 2022 and changes from the previous 12-month period for each end user:
Note: All data sources, methodologies and historical data series available at [[link removed]]
View this Report Online [[link removed]] The California Center for Jobs and the Economy provides an objective and definitive source of information pertaining to job creation and economic trends in California. [[link removed]] Contact 1301 I Street Sacramento, CA 95814 916.553.4093 If you no longer wish to receive these emails, select here to unsubscribe. [link removed]
February 2023
Below are the monthly updates from the most current February 2023 fuel price data (GasBuddy.com) and December 2022 electricity and natural gas price data (US Energy Information Administration). To view additional data and analysis related to the California economy visit our website at [[link removed]].
The added costs under California policies and regulations continue to keep prices at the highest or near the highest among the contiguous states across all energy sources.
The electricity rankings are adjusted to reflect the annual residential electricity bill is the result of the annual revisions to the data for 2022. The slippage in the residential natural gas rate reflects the price effects coming from the pipeline supply shortages affecting the state at the end of the year. Note that the rankings are relative to the contiguous states and DC and may differ from some of the rankings listed below that compare California to all 50 states and DC.
Gasoline prices moved somewhat higher in California but remained little changed in the rest of the country as the annual shift to the higher cost summer blends required by state regulations began. In the latest data from CSAA [[link removed]], prices continue to inch higher with the average California price at $4.90 on March 6, but the US average again largely unchanged from February at $3.41.
Diesel—which has a significant effect on the cost of food and other goods—was largely unchanged in California but down 3.6% in the other states. The latest CSAA data shows diesel dipping 5 cents in California, and easing 11 cents in the US as a whole.
Inflation Running Highest Since 1991 5.6% Annual Change in
California CPI
For the 12 months ending December, the California CPI rose 5.6%, easing from 6.5% in November. In the same period, the US CPI rose 6.5%, down from 7.1%. Looking at the period prior to 2022, California’s rate was the highest since January 1991.
California vs. Rest of US Fuel Price Gap at 43.3% Premium $1.43 Price per Gallon
Above US Average
(CA Average)
The February average price per gallon of regular gasoline in California rose 24 cents from January to $4.73. The California premium above the average for the US other than California ($3.30) rose to $1.43, a 43.3% difference.
2nd Ranked by
Price
In February, California had the 2nd highest gasoline price among the states and DC, behind only Hawaii. Californians paid $1.75 a gallon more than consumers in Texas, the state with the lowest price.
California vs. US Diesel Price $1.26 Price per Gallon
Above US Average
(CA Average)
The February average price per gallon of diesel in California eased 1 cent from January to $5.66. As prices dropped further in the other states, the California premium above the average for the US other than California ($4.40) rose to $1.26, a 28.6% difference.
2nd Ranked by
Price
In February, California had the 2nd highest diesel price among the states and DC, behind only Hawaii.
Range Between Highest and Lowest Prices by Region $1.55 Price per Gallon
Above US Average
(Central Sierra
Region)
The cost premium above the US (other than California) average price for regular gasoline ranged from $1.32 in the Central Valley Region (average February price of $4.62), to $1.55 in Central Sierra Region (average February price of $4.85).
Highest/Lowest Fuel Prices by Legislative District: California Residential Electricity Price 81.4% Above Average for
Rest of US
California average Residential Price for the 12 months ended December 2022 was 26.17 cents/kWh, 81.4% higher than the US average of 14.43 cents/kWh for all states other than California. California's residential prices again were the highest among the contiguous states.
California Residential Electric Bill 18th Ranked by
Cost
For the 12 months ended December 2022, the average annual Residential electricity bill in California was $1,707, or 71.7% higher ($713) than the comparable bill in 2010 (the year the AB 32 implementation began with the Early Action items). In this same period, the average US (less CA) electricity bill for all the other states grew only 20.1% ($274).
In 2010, California had the 9th lowest residential electricity bill in the nation. In the latest revised data for 2022, it had the 18th highest.
Residential bills, however, vary widely by region, with the estimated annual household usage in 2021 as much as 78% higher in the interior regions compared to the milder climate coastal areas, and substantially higher when comparing across counties.
$10.6b Premium Above
US Average Price
For the 12 months ended December 2022, California's higher electricity prices translated into Residential ratepayers paying $10.6 billion more than the average ratepayers elsewhere in the US using the same amount of energy.
California Commercial Electricity Price 85.1% Above Average for
Rest of US
California average Commercial Price for the 12 months ended December 2022 was 21.68 cents/kWh, 85.1% higher than the US average of 11.71 cents/kWh for all states other than California. California's commercial prices were the highest among the contiguous states.
California Industrial Electricity Price 116.3% Above Average for
Rest of US
California average Industrial Price for the 12 months ended December 2022 was 17.37 cents/kWh, 116.3% higher than the US average of 8.03 cents/kWh for all states other than California. California's industrial prices again were the third highest among the contiguous states.
$15.7b Premium Above
US Average Price
For the 12 months ended December 2022, California's higher electricity prices translated into Commercial & Industrial ratepayers paying $15.7 billion more than ratepayers elsewhere in the US using the same amount of energy. Compared to the lowest rate states, Commercial & Industrial ratepayers paid $20.6 billion more.
California Natural Gas Prices
Average prices ($ per thousand cubic feet; 12-month moving average) for the 12 months ended December 2022 and changes from the previous 12-month period for each end user:
Note: All data sources, methodologies and historical data series available at [[link removed]]
View this Report Online [[link removed]] The California Center for Jobs and the Economy provides an objective and definitive source of information pertaining to job creation and economic trends in California. [[link removed]] Contact 1301 I Street Sacramento, CA 95814 916.553.4093 If you no longer wish to receive these emails, select here to unsubscribe. [link removed]
Message Analysis
- Sender: California Center for Jobs and the Economy
- Political Party: n/a
- Country: United States
- State/Locality: California
- Office: n/a
-
Email Providers:
- Campaign Monitor