|
|
 |
|
|
|
|
Each week, we bring you a collection of the most viewed stories from The Daily Brew, condensed. Here are the top stories from the week of February 6-February 10. |
|
|
|
|
|
|
|
BALLOTPEDIA |
|
|
|
|
|
|
103 state legislative elections decided by 100 votes or fewer in 2022
|
|
|
|
|
|
|
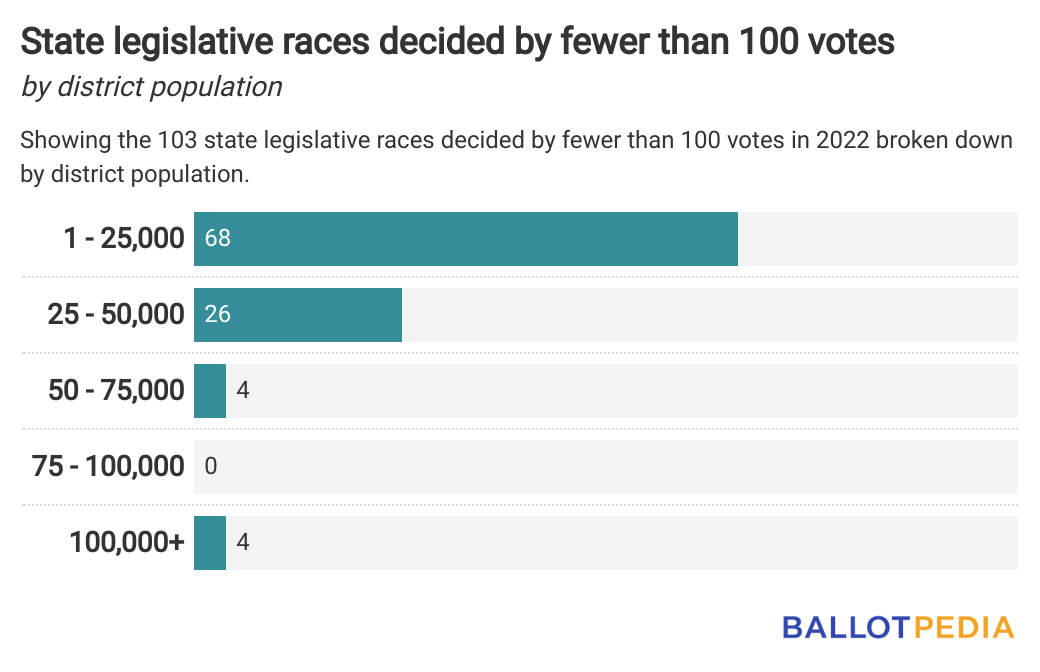
One hundred and three state legislative elections were decided by 100 votes or fewer in 2022, three times more than in 2020.
These 103 elections represented 1.6% of the 6,278 seats up for election in 2022. In 2020, 30 of the 5,875 seats up for election (0.5%) were decided within this margin.
Democrats won 49 of those 103 races (48%), Republicans won 52 (50%), and an independent won one (1%). An additional race in New Hampshire ended in a tie with a redo election scheduled for Feb. 21.
|
|
|
|
|
|
|
|
|
Average margin of victory in state legislative races continued upward trend in 2022
|
|
|
|
|
|
|
The average margin of victory in last year’s state legislative elections was 27.7 percentage points. This is the highest even-year average of the last three election cycles, up from 27.0 percentage points in 2020 and 25.8 in 2018.
The margin of victory is the difference between a winning candidate’s vote share and that of the runner-up. For example, if Candidate A wins with 55% of the vote and Candidate B finishes with 45%, the margin of victory is 10 percentage points.
Legislators in Alabama won by an average margin of 56.4 percentage points, the most in the country. Tennessee and Arkansas followed, with average margins of 42.8 and 39.9 percentage points, respectively.
New Hampshire had the closest races, with legislators winning by an average margin of 11.1 percentage points, followed by South Dakota and Nebraska with average margins of 17.1 and 17.7 percentage points, respectively.
|
|
|
|
|
|
|
|
|
Democrats regain majority in the Pennsylvania House
|
|
|
|
|
|
|
Pennsylvania held special elections to fill three vacancies in the state House of Representatives on Feb. 7. Let’s look at the results of those House elections and what they mean for the chamber’s partisan balance.
The special elections took place in three Pittsburgh-area districts—32, 34, and 35. Last November, Democrats won a 102 to 101 majority in the chamber, switching majority control for the first time since 2010. However, the Democratic-held districts became vacant after the election, giving Republicans a functional 101-99 majority when the legislative session began in early January.
When the winning candidates are sworn in, Democrats will have a 102-100 majority in the chamber (with one vacancy). The candidates are expected to be sworn into office before the end of the month.
|
|
|
|
|
|
|
|
|
|
Access to Ballotpedia is free 365 days per year... but Ballotpedia is not free to operate. Every dollar given to Ballotpedia helps ensure we continue to expand our coverage of all elections in the United States. Provide your support today and give the gift of unbiased political and policy information to all Ballotpedia readers. |
|
|
|
|
|