| From | Center for Jobs and the Economy <[email protected]> |
| Subject | California Energy Price Data for January 2023 |
| Date | February 7, 2023 10:30 PM |
Links have been removed from this email. Learn more in the FAQ.
Links have been removed from this email. Learn more in the FAQ.
Web Version [link removed] | Update Preferences [link removed] [link removed] California Energy Price Data
January 2023
Below are the monthly updates from the most current January 2023 fuel price data (GasBuddy.com) and November 2022 electricity and natural gas price data (US Energy Information Administration). To view additional data and analysis related to the California economy visit our website at [[link removed]].
California gasoline prices were up only marginally in January, remaining down 30% from the year’s high in June as supplies returned to—at least for California—near normal and due to regulatory easing through the annual shift to the less costly winter formulation. Diesel was largely unchanged, down 19% from the June high. Still, California prices for both fuels were the 2nd highest in the nation as the result of the state’s higher cost regulations, highest-in-the-nation fuel taxes, and state policies isolating the California market from a broader supply base.
In the latest results from CSAA [[link removed]] as of February 6, gasoline prices in California were 2.9% higher than January at $4.62 a gallon, and 2.1% for the overall US average at $3.47. Prices, however, are expected to ease at least nationally in February as inventories have recovered, demand remains low due to seasonal factors, and as crude oil prices have eased due to the strength of the US dollar.
As reflected in the January budget proposal, the governor remains focused on raising taxes and consequent costs of fuels even higher. But in sharp contrast to the relative easing of fuel prices, the latest data shows state policies pushing the costs of electricity and natural gas even higher. The November data shows the average (12-month moving average) residential electricity price up 16% from a year ago, and the average (12-month moving average) residential natural gas price up even higher at 24%.
These costs have risen even faster since. While natural gas prices have generally eased in the rest of the US, limited pipeline capacity into the state, colder temperatures, and declining in-state production have seen California spot prices rising to five times higher than in the rest of the nation [[link removed]]. The results are adding to costs of utility bills for heating and cooking, electricity production from natural gas plants, and input prices for products made from this energy source.
The reaction of the state to these rising costs again shows the weakness of the state’s approach to rising energy costs in general. When faced with the cost-of-living impact realities from the state’s policies, the state agencies have yet to consider a reassessment of their regulations in any of their actions affecting the supply and cost of energy. Instead, these reactions have focused almost solely on crafting some sort of compensation to households—but not to employers—for the resulting rising costs.
In the current actions, the Public Utilities Commission (PUC) recently approved an acceleration of the annual Climate Credit payments [[link removed]], moving up the spring credit payment to February or March depending on utility instead of the normal April payout. The Climate Credit is essentially a refund mechanism. Electricity and gas utilities along with other industries in the state are required to purchase emission credits under the state’s Cap and Trade Program. The cost of these credits adds to the cost of electricity and natural gas. However, a portion of the state’s proceeds from auctioning these credits is used by the PUC to fund the partial reimbursements to residential users. In other words, the state imposes a (rising) regulatory tax on energy use in the state, processes the proceeds through the state’s systems, and then returns a portion to a portion of the energy users faced with the resulting higher energy bills. The PUC’s action gives the appearance of reacting to the economic harm by moving up the otherwise required credits, not taking actions to deal with that harm directly and increase the reliability of supply and control the rising costs of energy in the state.
Inflation Running Highest Since 1990 6.2% Annual Change in
California CPI
For the 12 months ending November, the California CPI rose 6.2%, easing from 7.3% in October. In the same period, the US CPI rose 7.1%, down from 7.7%. Looking at the period prior to 2022, California’s rate was the highest since December 1990.
California vs. Rest of US Fuel Price Gap at 35.4% Premium $1.17 Price Per Gallon
Above US Average
(CA Average)
The January average price per gallon of regular gasoline in California rose 4 cents from December to $4.49. As prices rose relatively higher in the rest of the US, the California premium above the average for the US other than California ($3.31) eased to $1.17, a 35.4% difference.
2nd Ranked by
Price
In January, California had the 2nd highest gasoline price among the states and DC, behind only Hawaii. Californians paid $1.48 a gallon more than consumers in Texas, the state with the lowest price.
California vs. US Diesel Price $1.10 Price Per Gallon
Above US Average
(CA Average)
The January average price per gallon of diesel in California rose 1 cent from December to $5.67. The California premium above the average for the US other than California ($4.57) rose to $1.10, a 24.2% difference.
2nd Ranked by
Price
In January, California had the 2nd highest diesel price among the states and DC, behind only Hawaii.
Range Between Highest and Lowest Prices by Region $1.38 Price Per Gallon
Above US Average
(Central Coast Region)
The cost premium above the US (other than California) average price for regular gasoline ranged from $1.09 in the Sacramento Region (average January price of $4.40), to $1.38 in Central Coast Region (average January price of $4.69).
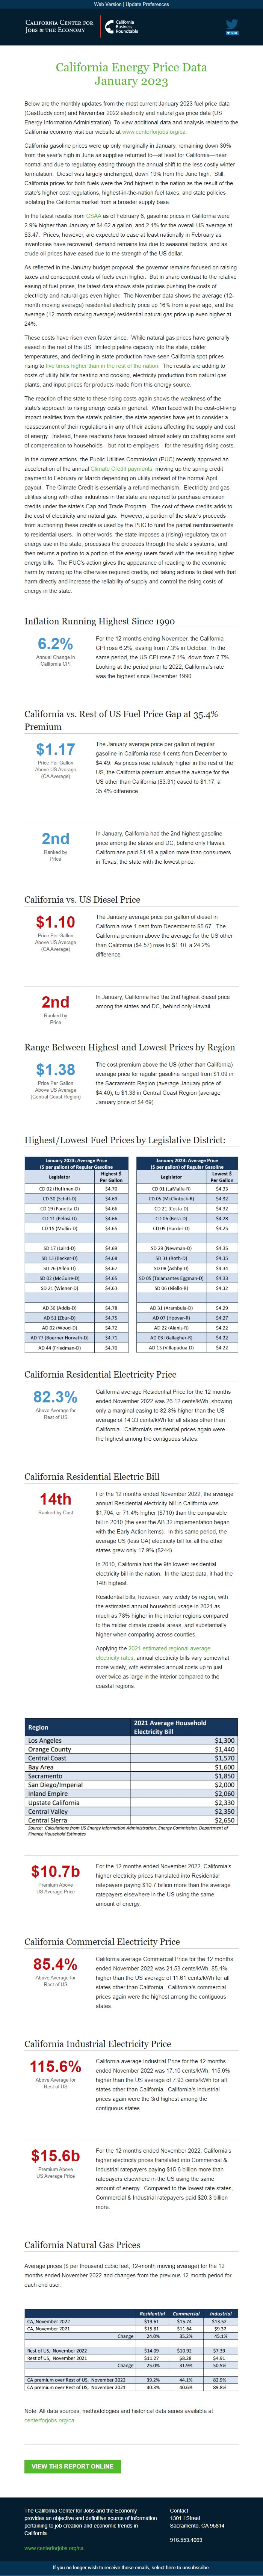
Highest/Lowest Fuel Prices by Legislative District: California Residential Electricity Price 82.3% Above Average for
Rest of US
California average Residential Price for the 12 months ended November 2022 was 26.12 cents/kWh, showing only a marginal easing to 82.3% higher than the US average of 14.33 cents/kWh for all states other than California. California's residential prices again were the highest among the contiguous states.
California Residential Electric Bill 14th Ranked by Cost
For the 12 months ended November 2022, the average annual Residential electricity bill in California was $1,704, or 71.4% higher ($710) than the comparable bill in 2010 (the year the AB 32 implementation began with the Early Action items). In this same period, the average US (less CA) electricity bill for all the other states grew only 17.9% ($244).
In 2010, California had the 9th lowest residential electricity bill in the nation. In the latest data, it had the 14th highest.
Residential bills, however, vary widely by region, with the estimated annual household usage in 2021 as much as 78% higher in the interior regions compared to the milder climate coastal areas, and substantially higher when comparing across counties.
Applying the 2021 estimated regional average electricity rates [[link removed]], annual electricity bills vary somewhat more widely, with estimated annual costs up to just over twice as large in the interior compared to the coastal regions.
$10.7b Premium Above
US Average Price
For the 12 months ended November 2022, California's higher electricity prices translated into Residential ratepayers paying $10.7 billion more than the average ratepayers elsewhere in the US using the same amount of energy.
California Commercial Electricity Price 85.4% Above Average for
Rest of US
California average Commercial Price for the 12 months ended November 2022 was 21.53 cents/kWh, 85.4% higher than the US average of 11.61 cents/kWh for all states other than California. California's commercial prices again were the highest among the contiguous states.
California Industrial Electricity Price 115.6% Above Average for
Rest of US
California average Industrial Price for the 12 months ended November 2022 was 17.10 cents/kWh, 115.6% higher than the US average of 7.93 cents/kWh for all states other than California. California's industrial prices again were the 3rd highest among the contiguous states.
$15.6b Premium Above
US Average Price
For the 12 months ended November 2022, California's higher electricity prices translated into Commercial & Industrial ratepayers paying $15.6 billion more than ratepayers elsewhere in the US using the same amount of energy. Compared to the lowest rate states, Commercial & Industrial ratepayers paid $20.3 billion more.
California Natural Gas Prices
Average prices ($ per thousand cubic feet; 12-month moving average) for the 12 months ended November 2022 and changes from the previous 12-month period for each end user:
Note: All data sources, methodologies and historical data series available at [[link removed]]
View this Report Online [[link removed]] The California Center for Jobs and the Economy provides an objective and definitive source of information pertaining to job creation and economic trends in California. [[link removed]] Contact 1301 I Street Sacramento, CA 95814 916.553.4093 If you no longer wish to receive these emails, select here to unsubscribe. [link removed]
January 2023
Below are the monthly updates from the most current January 2023 fuel price data (GasBuddy.com) and November 2022 electricity and natural gas price data (US Energy Information Administration). To view additional data and analysis related to the California economy visit our website at [[link removed]].
California gasoline prices were up only marginally in January, remaining down 30% from the year’s high in June as supplies returned to—at least for California—near normal and due to regulatory easing through the annual shift to the less costly winter formulation. Diesel was largely unchanged, down 19% from the June high. Still, California prices for both fuels were the 2nd highest in the nation as the result of the state’s higher cost regulations, highest-in-the-nation fuel taxes, and state policies isolating the California market from a broader supply base.
In the latest results from CSAA [[link removed]] as of February 6, gasoline prices in California were 2.9% higher than January at $4.62 a gallon, and 2.1% for the overall US average at $3.47. Prices, however, are expected to ease at least nationally in February as inventories have recovered, demand remains low due to seasonal factors, and as crude oil prices have eased due to the strength of the US dollar.
As reflected in the January budget proposal, the governor remains focused on raising taxes and consequent costs of fuels even higher. But in sharp contrast to the relative easing of fuel prices, the latest data shows state policies pushing the costs of electricity and natural gas even higher. The November data shows the average (12-month moving average) residential electricity price up 16% from a year ago, and the average (12-month moving average) residential natural gas price up even higher at 24%.
These costs have risen even faster since. While natural gas prices have generally eased in the rest of the US, limited pipeline capacity into the state, colder temperatures, and declining in-state production have seen California spot prices rising to five times higher than in the rest of the nation [[link removed]]. The results are adding to costs of utility bills for heating and cooking, electricity production from natural gas plants, and input prices for products made from this energy source.
The reaction of the state to these rising costs again shows the weakness of the state’s approach to rising energy costs in general. When faced with the cost-of-living impact realities from the state’s policies, the state agencies have yet to consider a reassessment of their regulations in any of their actions affecting the supply and cost of energy. Instead, these reactions have focused almost solely on crafting some sort of compensation to households—but not to employers—for the resulting rising costs.
In the current actions, the Public Utilities Commission (PUC) recently approved an acceleration of the annual Climate Credit payments [[link removed]], moving up the spring credit payment to February or March depending on utility instead of the normal April payout. The Climate Credit is essentially a refund mechanism. Electricity and gas utilities along with other industries in the state are required to purchase emission credits under the state’s Cap and Trade Program. The cost of these credits adds to the cost of electricity and natural gas. However, a portion of the state’s proceeds from auctioning these credits is used by the PUC to fund the partial reimbursements to residential users. In other words, the state imposes a (rising) regulatory tax on energy use in the state, processes the proceeds through the state’s systems, and then returns a portion to a portion of the energy users faced with the resulting higher energy bills. The PUC’s action gives the appearance of reacting to the economic harm by moving up the otherwise required credits, not taking actions to deal with that harm directly and increase the reliability of supply and control the rising costs of energy in the state.
Inflation Running Highest Since 1990 6.2% Annual Change in
California CPI
For the 12 months ending November, the California CPI rose 6.2%, easing from 7.3% in October. In the same period, the US CPI rose 7.1%, down from 7.7%. Looking at the period prior to 2022, California’s rate was the highest since December 1990.
California vs. Rest of US Fuel Price Gap at 35.4% Premium $1.17 Price Per Gallon
Above US Average
(CA Average)
The January average price per gallon of regular gasoline in California rose 4 cents from December to $4.49. As prices rose relatively higher in the rest of the US, the California premium above the average for the US other than California ($3.31) eased to $1.17, a 35.4% difference.
2nd Ranked by
Price
In January, California had the 2nd highest gasoline price among the states and DC, behind only Hawaii. Californians paid $1.48 a gallon more than consumers in Texas, the state with the lowest price.
California vs. US Diesel Price $1.10 Price Per Gallon
Above US Average
(CA Average)
The January average price per gallon of diesel in California rose 1 cent from December to $5.67. The California premium above the average for the US other than California ($4.57) rose to $1.10, a 24.2% difference.
2nd Ranked by
Price
In January, California had the 2nd highest diesel price among the states and DC, behind only Hawaii.
Range Between Highest and Lowest Prices by Region $1.38 Price Per Gallon
Above US Average
(Central Coast Region)
The cost premium above the US (other than California) average price for regular gasoline ranged from $1.09 in the Sacramento Region (average January price of $4.40), to $1.38 in Central Coast Region (average January price of $4.69).
Highest/Lowest Fuel Prices by Legislative District: California Residential Electricity Price 82.3% Above Average for
Rest of US
California average Residential Price for the 12 months ended November 2022 was 26.12 cents/kWh, showing only a marginal easing to 82.3% higher than the US average of 14.33 cents/kWh for all states other than California. California's residential prices again were the highest among the contiguous states.
California Residential Electric Bill 14th Ranked by Cost
For the 12 months ended November 2022, the average annual Residential electricity bill in California was $1,704, or 71.4% higher ($710) than the comparable bill in 2010 (the year the AB 32 implementation began with the Early Action items). In this same period, the average US (less CA) electricity bill for all the other states grew only 17.9% ($244).
In 2010, California had the 9th lowest residential electricity bill in the nation. In the latest data, it had the 14th highest.
Residential bills, however, vary widely by region, with the estimated annual household usage in 2021 as much as 78% higher in the interior regions compared to the milder climate coastal areas, and substantially higher when comparing across counties.
Applying the 2021 estimated regional average electricity rates [[link removed]], annual electricity bills vary somewhat more widely, with estimated annual costs up to just over twice as large in the interior compared to the coastal regions.
$10.7b Premium Above
US Average Price
For the 12 months ended November 2022, California's higher electricity prices translated into Residential ratepayers paying $10.7 billion more than the average ratepayers elsewhere in the US using the same amount of energy.
California Commercial Electricity Price 85.4% Above Average for
Rest of US
California average Commercial Price for the 12 months ended November 2022 was 21.53 cents/kWh, 85.4% higher than the US average of 11.61 cents/kWh for all states other than California. California's commercial prices again were the highest among the contiguous states.
California Industrial Electricity Price 115.6% Above Average for
Rest of US
California average Industrial Price for the 12 months ended November 2022 was 17.10 cents/kWh, 115.6% higher than the US average of 7.93 cents/kWh for all states other than California. California's industrial prices again were the 3rd highest among the contiguous states.
$15.6b Premium Above
US Average Price
For the 12 months ended November 2022, California's higher electricity prices translated into Commercial & Industrial ratepayers paying $15.6 billion more than ratepayers elsewhere in the US using the same amount of energy. Compared to the lowest rate states, Commercial & Industrial ratepayers paid $20.3 billion more.
California Natural Gas Prices
Average prices ($ per thousand cubic feet; 12-month moving average) for the 12 months ended November 2022 and changes from the previous 12-month period for each end user:
Note: All data sources, methodologies and historical data series available at [[link removed]]
View this Report Online [[link removed]] The California Center for Jobs and the Economy provides an objective and definitive source of information pertaining to job creation and economic trends in California. [[link removed]] Contact 1301 I Street Sacramento, CA 95814 916.553.4093 If you no longer wish to receive these emails, select here to unsubscribe. [link removed]
Message Analysis
- Sender: California Center for Jobs and the Economy
- Political Party: n/a
- Country: United States
- State/Locality: California
- Office: n/a
-
Email Providers:
- Campaign Monitor