| From | Center for Jobs and the Economy <[email protected]> |
| Subject | California Trade Report for July 2022 |
| Date | September 7, 2022 11:00 PM |
Links have been removed from this email. Learn more in the FAQ.
Links have been removed from this email. Learn more in the FAQ.
Web Version [link removed] | Update Preferences [link removed] [link removed] California Trade Report
for July 2022
Below are highlights from the recently released trade data from the US Census Bureau and US Bureau of Economic Analysis. To view additional data and analysis related to the California economy visit our website at [[link removed]].
The July data especially when viewed in real terms saw continued erosion in the state’s trade posture. Origin exports while up marginally from a year ago in nominal terms were down in real terms. Destination imports were up sharply in both nominal and real terms. Overall, California’s share of total trade through US ports continued reaching a new low in the current data series, as did the state’s share of total origin exports.
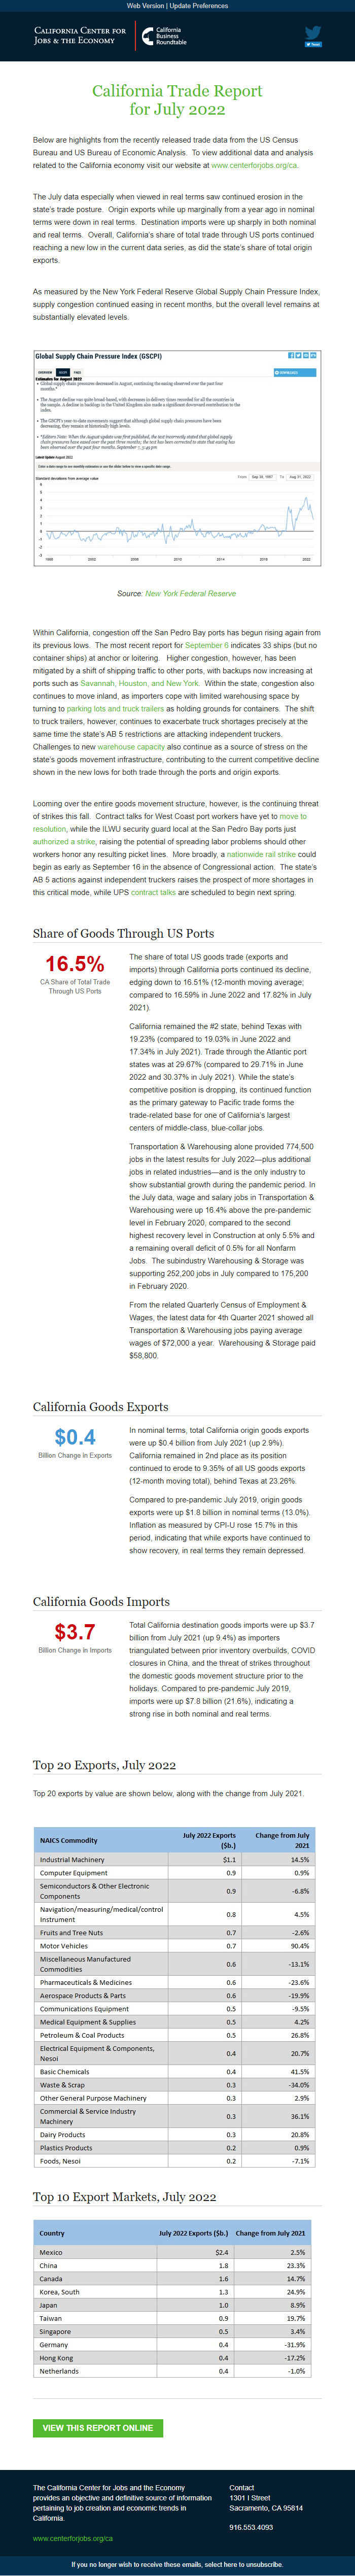
As measured by the New York Federal Reserve Global Supply Chain Pressure Index, supply congestion continued easing in recent months, but the overall level remains at substantially elevated levels.
Source: New York Federal Reserve [[link removed]]
Within California, congestion off the San Pedro Bay ports has begun rising again from its previous lows. The most recent report for September 6 [[link removed]] indicates 33 ships (but no container ships) at anchor or loitering. Higher congestion, however, has been mitigated by a shift of shipping traffic to other ports, with backups now increasing at ports such as Savannah, Houston, and New York [[link removed]]. Within the state, congestion also continues to move inland, as importers cope with limited warehousing space by turning to parking lots and truck trailers [[link removed]] as holding grounds for containers. The shift to truck trailers, however, continues to exacerbate truck shortages precisely at the same time the state’s AB 5 restrictions are attacking independent truckers. Challenges to new warehouse capacity [[link removed]] also continue as a source of stress on the state’s goods movement infrastructure, contributing to the current competitive decline shown in the new lows for both trade through the ports and origin exports.
Looming over the entire goods movement structure, however, is the continuing threat of strikes this fall. Contract talks for West Coast port workers have yet to move to resolution [[link removed]], while the ILWU security guard local at the San Pedro Bay ports just authorized a strike [[link removed]], raising the potential of spreading labor problems should other workers honor any resulting picket lines. More broadly, a nationwide rail strike [[link removed]] could begin as early as September 16 in the absence of Congressional action. The state’s AB 5 actions against independent truckers raises the prospect of more shortages in this critical mode, while UPS contract talks [[link removed]] are scheduled to begin next spring.
Share of Goods Through US Ports 16.5% CA Share of Total Trade
Through US Ports
The share of total US goods trade (exports and imports) through California ports continued its decline, edging down to 16.51% (12-month moving average; compared to 16.59% in June 2022 and 17.82% in July 2021).
California remained the #2 state, behind Texas with 19.23% (compared to 19.03% in June 2022 and 17.34% in July 2021). Trade through the Atlantic port states was at 29.67% (compared to 29.71% in June 2022 and 30.37% in July 2021). While the state’s competitive position is dropping, its continued function as the primary gateway to Pacific trade forms the trade-related base for one of California’s largest centers of middle-class, blue-collar jobs.
Transportation & Warehousing alone provided 774,500 jobs in the latest results for July 2022—plus additional jobs in related industries—and is the only industry to show substantial growth during the pandemic period. In the July data, wage and salary jobs in Transportation & Warehousing were up 16.4% above the pre-pandemic level in February 2020, compared to the second highest recovery level in Construction at only 5.5% and a remaining overall deficit of 0.5% for all Nonfarm Jobs. The subindustry Warehousing & Storage was supporting 252,200 jobs in July compared to 175,200 in February 2020.
From the related Quarterly Census of Employment & Wages, the latest data for 4th Quarter 2021 showed all Transportation & Warehousing jobs paying average wages of $72,000 a year. Warehousing & Storage paid $58,800.
California Goods Exports $0.4 Billion Change in Exports
In nominal terms, total California origin goods exports were up $0.4 billion from July 2021 (up 2.9%). California remained in 2nd place as its position continued to erode to 9.35% of all US goods exports (12-month moving total), behind Texas at 23.26%.
Compared to pre-pandemic July 2019, origin goods exports were up $1.8 billion in nominal terms (13.0%). Inflation as measured by CPI-U rose 15.7% in this period, indicating that while exports have continued to show recovery, in real terms they remain depressed.
California Goods Imports $3.7 Billion Change in Imports
Total California destination goods imports were up $3.7 billion from July 2021 (up 9.4%) as importers triangulated between prior inventory overbuilds, COVID closures in China, and the threat of strikes throughout the domestic goods movement structure prior to the holidays. Compared to pre-pandemic July 2019, imports were up $7.8 billion (21.6%), indicating a strong rise in both nominal and real terms.
Top 20 Exports, July 2022
Top 20 exports by value are shown below, along with the change from July 2021.
Top 10 Export Markets, July 2022 View This Report Online [[link removed]] The California Center for Jobs and the Economy provides an objective and definitive source of information pertaining to job creation and economic trends in California. [[link removed]] Contact 1301 I Street Sacramento, CA 95814 916.553.4093 If you no longer wish to receive these emails, select here to unsubscribe. [link removed]
for July 2022
Below are highlights from the recently released trade data from the US Census Bureau and US Bureau of Economic Analysis. To view additional data and analysis related to the California economy visit our website at [[link removed]].
The July data especially when viewed in real terms saw continued erosion in the state’s trade posture. Origin exports while up marginally from a year ago in nominal terms were down in real terms. Destination imports were up sharply in both nominal and real terms. Overall, California’s share of total trade through US ports continued reaching a new low in the current data series, as did the state’s share of total origin exports.
As measured by the New York Federal Reserve Global Supply Chain Pressure Index, supply congestion continued easing in recent months, but the overall level remains at substantially elevated levels.
Source: New York Federal Reserve [[link removed]]
Within California, congestion off the San Pedro Bay ports has begun rising again from its previous lows. The most recent report for September 6 [[link removed]] indicates 33 ships (but no container ships) at anchor or loitering. Higher congestion, however, has been mitigated by a shift of shipping traffic to other ports, with backups now increasing at ports such as Savannah, Houston, and New York [[link removed]]. Within the state, congestion also continues to move inland, as importers cope with limited warehousing space by turning to parking lots and truck trailers [[link removed]] as holding grounds for containers. The shift to truck trailers, however, continues to exacerbate truck shortages precisely at the same time the state’s AB 5 restrictions are attacking independent truckers. Challenges to new warehouse capacity [[link removed]] also continue as a source of stress on the state’s goods movement infrastructure, contributing to the current competitive decline shown in the new lows for both trade through the ports and origin exports.
Looming over the entire goods movement structure, however, is the continuing threat of strikes this fall. Contract talks for West Coast port workers have yet to move to resolution [[link removed]], while the ILWU security guard local at the San Pedro Bay ports just authorized a strike [[link removed]], raising the potential of spreading labor problems should other workers honor any resulting picket lines. More broadly, a nationwide rail strike [[link removed]] could begin as early as September 16 in the absence of Congressional action. The state’s AB 5 actions against independent truckers raises the prospect of more shortages in this critical mode, while UPS contract talks [[link removed]] are scheduled to begin next spring.
Share of Goods Through US Ports 16.5% CA Share of Total Trade
Through US Ports
The share of total US goods trade (exports and imports) through California ports continued its decline, edging down to 16.51% (12-month moving average; compared to 16.59% in June 2022 and 17.82% in July 2021).
California remained the #2 state, behind Texas with 19.23% (compared to 19.03% in June 2022 and 17.34% in July 2021). Trade through the Atlantic port states was at 29.67% (compared to 29.71% in June 2022 and 30.37% in July 2021). While the state’s competitive position is dropping, its continued function as the primary gateway to Pacific trade forms the trade-related base for one of California’s largest centers of middle-class, blue-collar jobs.
Transportation & Warehousing alone provided 774,500 jobs in the latest results for July 2022—plus additional jobs in related industries—and is the only industry to show substantial growth during the pandemic period. In the July data, wage and salary jobs in Transportation & Warehousing were up 16.4% above the pre-pandemic level in February 2020, compared to the second highest recovery level in Construction at only 5.5% and a remaining overall deficit of 0.5% for all Nonfarm Jobs. The subindustry Warehousing & Storage was supporting 252,200 jobs in July compared to 175,200 in February 2020.
From the related Quarterly Census of Employment & Wages, the latest data for 4th Quarter 2021 showed all Transportation & Warehousing jobs paying average wages of $72,000 a year. Warehousing & Storage paid $58,800.
California Goods Exports $0.4 Billion Change in Exports
In nominal terms, total California origin goods exports were up $0.4 billion from July 2021 (up 2.9%). California remained in 2nd place as its position continued to erode to 9.35% of all US goods exports (12-month moving total), behind Texas at 23.26%.
Compared to pre-pandemic July 2019, origin goods exports were up $1.8 billion in nominal terms (13.0%). Inflation as measured by CPI-U rose 15.7% in this period, indicating that while exports have continued to show recovery, in real terms they remain depressed.
California Goods Imports $3.7 Billion Change in Imports
Total California destination goods imports were up $3.7 billion from July 2021 (up 9.4%) as importers triangulated between prior inventory overbuilds, COVID closures in China, and the threat of strikes throughout the domestic goods movement structure prior to the holidays. Compared to pre-pandemic July 2019, imports were up $7.8 billion (21.6%), indicating a strong rise in both nominal and real terms.
Top 20 Exports, July 2022
Top 20 exports by value are shown below, along with the change from July 2021.
Top 10 Export Markets, July 2022 View This Report Online [[link removed]] The California Center for Jobs and the Economy provides an objective and definitive source of information pertaining to job creation and economic trends in California. [[link removed]] Contact 1301 I Street Sacramento, CA 95814 916.553.4093 If you no longer wish to receive these emails, select here to unsubscribe. [link removed]
Message Analysis
- Sender: California Center for Jobs and the Economy
- Political Party: n/a
- Country: United States
- State/Locality: California
- Office: n/a
-
Email Providers:
- Campaign Monitor