| From | Center for Jobs and the Economy <[email protected]> |
| Subject | California Trade Report for October 2019 |
| Date | December 5, 2019 11:00 PM |
Links have been removed from this email. Learn more in the FAQ.
Links have been removed from this email. Learn more in the FAQ.
Web Version [link removed] | Update Preferences [link removed] [link removed] California Trade Report
for October 2019
Below are highlights from the recently released trade data from the US Census Bureau and US Bureau of Economic Analysis. To view additional data and analysis related to the California economy visit our website at www.centerforjobs.org/ca. [[link removed]]
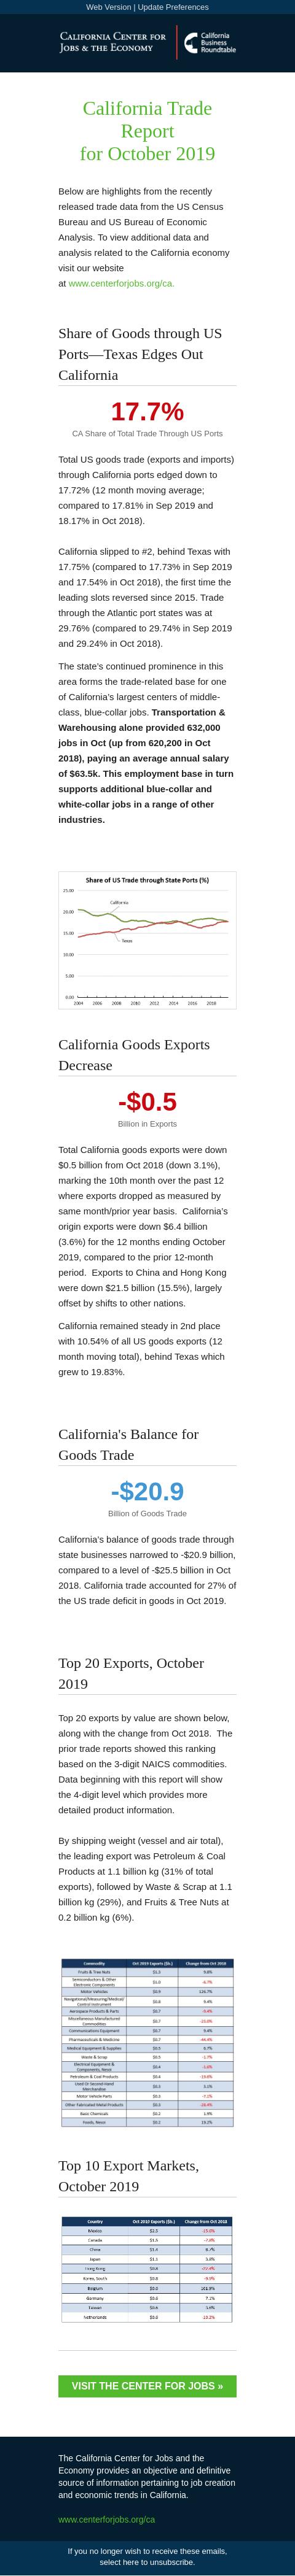
Share of Goods through US Ports—Texas Edges Out California 17.7% CA Share of Total Trade Through US Ports
Total US goods trade (exports and imports) through California ports edged down to 17.72% (12 month moving average; compared to 17.81% in Sep 2019 and 18.17% in Oct 2018).
California slipped to #2, behind Texas with 17.75% (compared to 17.73% in Sep 2019 and 17.54% in Oct 2018), the first time the leading slots reversed since 2015. Trade through the Atlantic port states was at 29.76% (compared to 29.74% in Sep 2019 and 29.24% in Oct 2018).
The state’s continued prominence in this area forms the trade-related base for one of California’s largest centers of middle-class, blue-collar jobs. Transportation & Warehousing alone provided 632,000 jobs in Oct (up from 620,200 in Oct 2018), paying an average annual salary of $63.5k. This employment base in turn supports additional blue-collar and white-collar jobs in a range of other industries.
California Goods Exports Decrease -$0.5 Billion in Exports
Total California goods exports were down $0.5 billion from Oct 2018 (down 3.1%), marking the 10th month over the past 12 where exports dropped as measured by same month/prior year basis. California’s origin exports were down $6.4 billion (3.6%) for the 12 months ending October 2019, compared to the prior 12-month period. Exports to China and Hong Kong were down $21.5 billion (15.5%), largely offset by shifts to other nations.
California remained steady in 2nd place with 10.54% of all US goods exports (12 month moving total), behind Texas which grew to 19.83%.
California's Balance for Goods Trade -$20.9 Billion of Goods Trade
California’s balance of goods trade through state businesses narrowed to -$20.9 billion, compared to a level of -$25.5 billion in Oct 2018. California trade accounted for 27% of the US trade deficit in goods in Oct 2019.
Top 20 Exports, October 2019
Top 20 exports by value are shown below, along with the change from Oct 2018. The prior trade reports showed this ranking based on the 3-digit NAICS commodities. Data beginning with this report will show the 4-digit level which provides more detailed product information.
By shipping weight (vessel and air total), the leading export was Petroleum & Coal Products at 1.1 billion kg (31% of total exports), followed by Waste & Scrap at 1.1 billion kg (29%), and Fruits & Tree Nuts at 0.2 billion kg (6%).
Top 10 Export Markets, October 2019 Visit the center for jobs » [[link removed]] The California Center for Jobs and the Economy provides an objective and definitive source of information pertaining to job creation and economic trends in California. [[link removed]] Contact 1301 I Street Sacramento, CA 95814 916.553.4093 If you no longer wish to receive these emails, select here to unsubscribe. [link removed]
for October 2019
Below are highlights from the recently released trade data from the US Census Bureau and US Bureau of Economic Analysis. To view additional data and analysis related to the California economy visit our website at www.centerforjobs.org/ca. [[link removed]]
Share of Goods through US Ports—Texas Edges Out California 17.7% CA Share of Total Trade Through US Ports
Total US goods trade (exports and imports) through California ports edged down to 17.72% (12 month moving average; compared to 17.81% in Sep 2019 and 18.17% in Oct 2018).
California slipped to #2, behind Texas with 17.75% (compared to 17.73% in Sep 2019 and 17.54% in Oct 2018), the first time the leading slots reversed since 2015. Trade through the Atlantic port states was at 29.76% (compared to 29.74% in Sep 2019 and 29.24% in Oct 2018).
The state’s continued prominence in this area forms the trade-related base for one of California’s largest centers of middle-class, blue-collar jobs. Transportation & Warehousing alone provided 632,000 jobs in Oct (up from 620,200 in Oct 2018), paying an average annual salary of $63.5k. This employment base in turn supports additional blue-collar and white-collar jobs in a range of other industries.
California Goods Exports Decrease -$0.5 Billion in Exports
Total California goods exports were down $0.5 billion from Oct 2018 (down 3.1%), marking the 10th month over the past 12 where exports dropped as measured by same month/prior year basis. California’s origin exports were down $6.4 billion (3.6%) for the 12 months ending October 2019, compared to the prior 12-month period. Exports to China and Hong Kong were down $21.5 billion (15.5%), largely offset by shifts to other nations.
California remained steady in 2nd place with 10.54% of all US goods exports (12 month moving total), behind Texas which grew to 19.83%.
California's Balance for Goods Trade -$20.9 Billion of Goods Trade
California’s balance of goods trade through state businesses narrowed to -$20.9 billion, compared to a level of -$25.5 billion in Oct 2018. California trade accounted for 27% of the US trade deficit in goods in Oct 2019.
Top 20 Exports, October 2019
Top 20 exports by value are shown below, along with the change from Oct 2018. The prior trade reports showed this ranking based on the 3-digit NAICS commodities. Data beginning with this report will show the 4-digit level which provides more detailed product information.
By shipping weight (vessel and air total), the leading export was Petroleum & Coal Products at 1.1 billion kg (31% of total exports), followed by Waste & Scrap at 1.1 billion kg (29%), and Fruits & Tree Nuts at 0.2 billion kg (6%).
Top 10 Export Markets, October 2019 Visit the center for jobs » [[link removed]] The California Center for Jobs and the Economy provides an objective and definitive source of information pertaining to job creation and economic trends in California. [[link removed]] Contact 1301 I Street Sacramento, CA 95814 916.553.4093 If you no longer wish to receive these emails, select here to unsubscribe. [link removed]
Message Analysis
- Sender: California Center for Jobs and the Economy
- Political Party: n/a
- Country: United States
- State/Locality: California
- Office: n/a
-
Email Providers:
- Campaign Monitor