| From | Center for Jobs and the Economy <[email protected]> |
| Subject | California Trade Report for February 2022 |
| Date | April 5, 2022 10:46 PM |
Links have been removed from this email. Learn more in the FAQ.
Links have been removed from this email. Learn more in the FAQ.
Web Version [link removed] | Update Preferences [link removed] [link removed] California Trade Report
for February 2022
Below are highlights from the recently released trade data from the US Census Bureau and US Bureau of Economic Analysis. To view additional data and analysis related to the California economy visit our website at www.[[link removed]].
In nominal terms, the February 2022 results continue to show California exports and trade flows through the state’s ports above the pre-pandemic levels in February 2020. Due to rapidly rising inflation, exports in real dollars were down just over 5%, while imports continued to surge as companies sought to counter renewed closures in China and concerns over a possible West Coast ports strike. [[link removed]]
Port congestion remains high but continues to ease from the peak backup of 109 container vessels recorded for the Ports of Los Angeles and Long Beach on January 9. On October 20, 2021 when the state issued its measures [[link removed]]to tackle the ongoing supply chain issues, the backup was at 71 container ships and 108 total ships at anchor or loitering off the ports. In the latest numbers [[link removed]] for April 1, the total container ship backup was 41.
Overall, supply chain blockages remain elevated but somewhat improved from their prior peaks. In an update [[link removed]] to their Global Supply Chain Index, the New York Fed Liberty Street Economics indicates that supply chain conditions within the US are only somewhat better than the overall global average. The Index is based on a composite of trade and trade congestion statistics, with the Index expressed as the number of standard deviations from the long-term average level.
Conditions within China, however, continue to worsen in part due to renewed shutdowns. The Euro Area instead shows overall better supply chain health, but with renewed deterioration likely to worsen as the war in Ukraine lengthens.
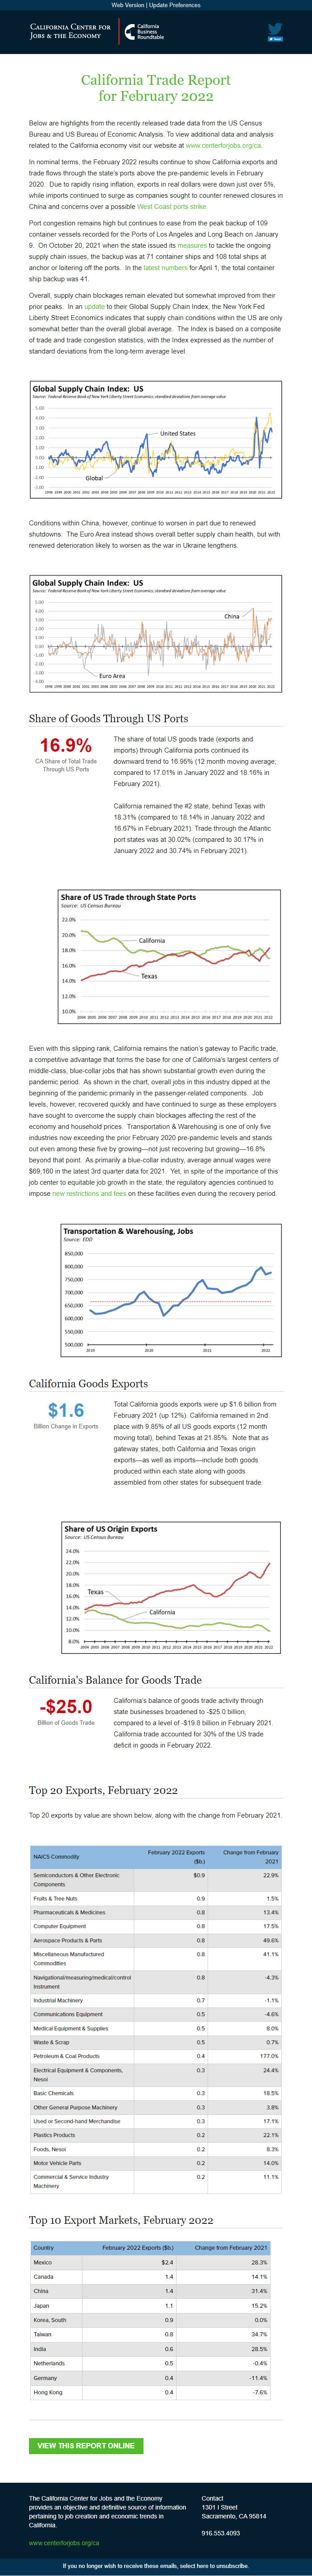
Share of Goods Through US Ports 16.9% CA Share of Total Trade
Through US Ports
The share of total US goods trade (exports and imports) through California ports continued its downward trend to 16.95% (12 month moving average; compared to 17.01% in January 2022 and 18.16% in February 2021).
California remained the #2 state, behind Texas with 18.31% (compared to 18.14% in January 2022 and 16.67% in February 2021). Trade through the Atlantic port states was at 30.02% (compared to 30.17% in January 2022 and 30.74% in February 2021).
Even with this slipping rank, California remains the nation’s gateway to Pacific trade, a competitive advantage that forms the base for one of California’s largest centers of middle-class, blue-collar jobs that has shown substantial growth even during the pandemic period. As shown in the chart, overall jobs in this industry dipped at the beginning of the pandemic primarily in the passenger-related components. Job levels, however, recovered quickly and have continued to surge as these employers have sought to overcome the supply chain blockages affecting the rest of the economy and household prices. Transportation & Warehousing is one of only five industries now exceeding the prior February 2020 pre-pandemic levels and stands out even among these five by growing—not just recovering but growing—16.8% beyond that point. As primarily a blue-collar industry, average annual wages were $69,160 in the latest 3rd quarter data for 2021. Yet, in spite of the importance of this job center to equitable job growth in the state, the regulatory agencies continued to impose new restrictions and fees [[link removed]] on these facilities even during the recovery period.
California Goods Exports $1.6 Billion Change in Exports
Total California goods exports were up $1.6 billion from February 2021 (up 12%). California remained in 2nd place with 9.85% of all US goods exports (12 month moving total), behind Texas at 21.85%. Note that as gateway states, both California and Texas origin exports—as well as imports—include both goods produced within each state along with goods assembled from other states for subsequent trade.
California's Balance for Goods Trade -$25.0 Billion of Goods Trade
California’s balance of goods trade activity through state businesses broadened to -$25.0 billion, compared to a level of -$19.8 billion in February 2021. California trade accounted for 30% of the US trade deficit in goods in February 2022.
Top 20 Exports, February 2022
Top 20 exports by value are shown below, along with the change from February 2021.
Top 10 Export Markets, February 2022 View This Report Online [[link removed]] The California Center for Jobs and the Economy provides an objective and definitive source of information pertaining to job creation and economic trends in California. [[link removed]] Contact 1301 I Street Sacramento, CA 95814 916.553.4093 If you no longer wish to receive these emails, select here to unsubscribe. [link removed]
for February 2022
Below are highlights from the recently released trade data from the US Census Bureau and US Bureau of Economic Analysis. To view additional data and analysis related to the California economy visit our website at www.[[link removed]].
In nominal terms, the February 2022 results continue to show California exports and trade flows through the state’s ports above the pre-pandemic levels in February 2020. Due to rapidly rising inflation, exports in real dollars were down just over 5%, while imports continued to surge as companies sought to counter renewed closures in China and concerns over a possible West Coast ports strike. [[link removed]]
Port congestion remains high but continues to ease from the peak backup of 109 container vessels recorded for the Ports of Los Angeles and Long Beach on January 9. On October 20, 2021 when the state issued its measures [[link removed]]to tackle the ongoing supply chain issues, the backup was at 71 container ships and 108 total ships at anchor or loitering off the ports. In the latest numbers [[link removed]] for April 1, the total container ship backup was 41.
Overall, supply chain blockages remain elevated but somewhat improved from their prior peaks. In an update [[link removed]] to their Global Supply Chain Index, the New York Fed Liberty Street Economics indicates that supply chain conditions within the US are only somewhat better than the overall global average. The Index is based on a composite of trade and trade congestion statistics, with the Index expressed as the number of standard deviations from the long-term average level.
Conditions within China, however, continue to worsen in part due to renewed shutdowns. The Euro Area instead shows overall better supply chain health, but with renewed deterioration likely to worsen as the war in Ukraine lengthens.
Share of Goods Through US Ports 16.9% CA Share of Total Trade
Through US Ports
The share of total US goods trade (exports and imports) through California ports continued its downward trend to 16.95% (12 month moving average; compared to 17.01% in January 2022 and 18.16% in February 2021).
California remained the #2 state, behind Texas with 18.31% (compared to 18.14% in January 2022 and 16.67% in February 2021). Trade through the Atlantic port states was at 30.02% (compared to 30.17% in January 2022 and 30.74% in February 2021).
Even with this slipping rank, California remains the nation’s gateway to Pacific trade, a competitive advantage that forms the base for one of California’s largest centers of middle-class, blue-collar jobs that has shown substantial growth even during the pandemic period. As shown in the chart, overall jobs in this industry dipped at the beginning of the pandemic primarily in the passenger-related components. Job levels, however, recovered quickly and have continued to surge as these employers have sought to overcome the supply chain blockages affecting the rest of the economy and household prices. Transportation & Warehousing is one of only five industries now exceeding the prior February 2020 pre-pandemic levels and stands out even among these five by growing—not just recovering but growing—16.8% beyond that point. As primarily a blue-collar industry, average annual wages were $69,160 in the latest 3rd quarter data for 2021. Yet, in spite of the importance of this job center to equitable job growth in the state, the regulatory agencies continued to impose new restrictions and fees [[link removed]] on these facilities even during the recovery period.
California Goods Exports $1.6 Billion Change in Exports
Total California goods exports were up $1.6 billion from February 2021 (up 12%). California remained in 2nd place with 9.85% of all US goods exports (12 month moving total), behind Texas at 21.85%. Note that as gateway states, both California and Texas origin exports—as well as imports—include both goods produced within each state along with goods assembled from other states for subsequent trade.
California's Balance for Goods Trade -$25.0 Billion of Goods Trade
California’s balance of goods trade activity through state businesses broadened to -$25.0 billion, compared to a level of -$19.8 billion in February 2021. California trade accounted for 30% of the US trade deficit in goods in February 2022.
Top 20 Exports, February 2022
Top 20 exports by value are shown below, along with the change from February 2021.
Top 10 Export Markets, February 2022 View This Report Online [[link removed]] The California Center for Jobs and the Economy provides an objective and definitive source of information pertaining to job creation and economic trends in California. [[link removed]] Contact 1301 I Street Sacramento, CA 95814 916.553.4093 If you no longer wish to receive these emails, select here to unsubscribe. [link removed]
Message Analysis
- Sender: California Center for Jobs and the Economy
- Political Party: n/a
- Country: United States
- State/Locality: California
- Office: n/a
-
Email Providers:
- Campaign Monitor