| From | Center for Jobs and the Economy <[email protected]> |
| Subject | California Trade Report for January 2022 |
| Date | March 9, 2022 6:30 PM |
Links have been removed from this email. Learn more in the FAQ.
Links have been removed from this email. Learn more in the FAQ.
Web Version [link removed] | Update Preferences [link removed] [link removed] California Trade Report
for January 2022
Below are highlights from the recently released trade data from the US Census Bureau and US Bureau of Economic Analysis. To view additional data and analysis related to the California economy visit our website at www.[[link removed]].
In nominal terms, the January 2022 results show both California exports and trade flows through the state’s ports back to or above the pre-pandemic January 2020 levels. In real terms, however, as measured by the CPI, export levels and flows remain down, while the overall numbers remain dominated by a steep rise in imports.
Port congestion remains high but easing from the peak backup of 109 container vessels recorded for the Ports of Los Angeles and Long Beach on January 9. On October 20, 2021 when the state issued its measures [[link removed]] to tackle the ongoing supply chain issues, the backup was at 71 container ships and 108 total ships at anchor or loitering off the ports. In the latest numbers [[link removed]] for March 4, the total container ship backup was 56.
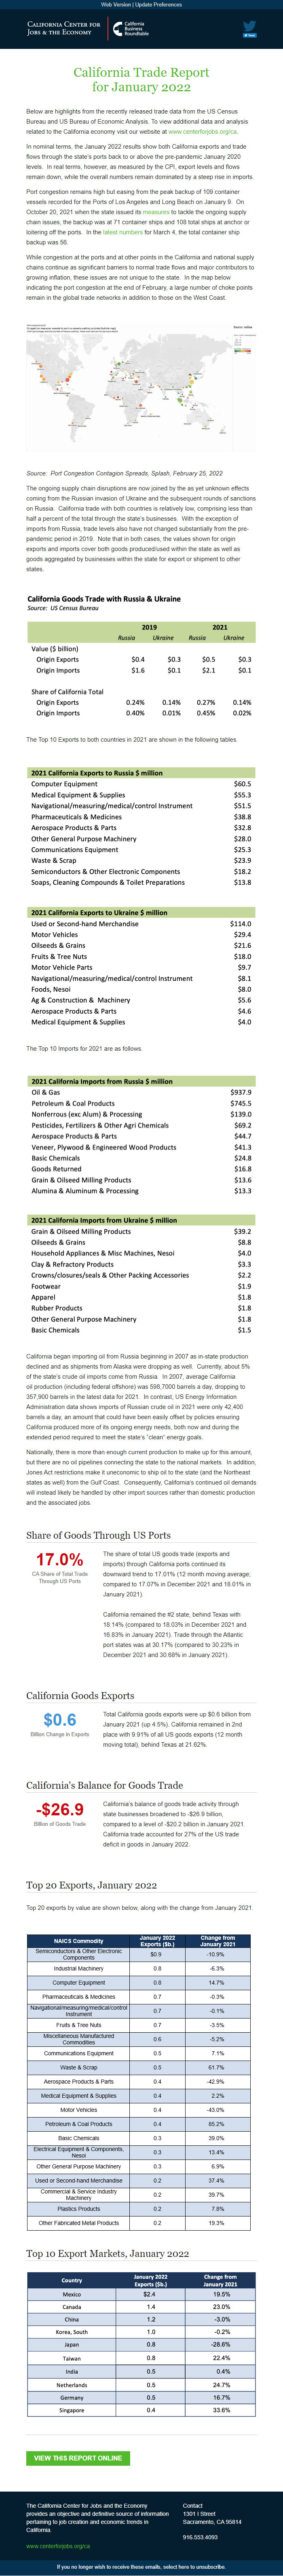
While congestion at the ports and at other points in the California and national supply chains continue as significant barriers to normal trade flows and major contributors to growing inflation, these issues are not unique to the state. In the map below indicating the port congestion at the end of February, a large number of choke points remain in the global trade networks in addition to those on the West Coast.
Source: Port Congestion Contagion Spreads, Splash, February 25, 2022
The ongoing supply chain disruptions are now joined by the as yet unknown effects coming from the Russian invasion of Ukraine and the subsequent rounds of sanctions on Russia. California trade with both countries is relatively low, comprising less than half a percent of the total through the state’s businesses. With the exception of imports from Russia, trade levels also have not changed substantially from the pre-pandemic period in 2019. Note that in both cases, the values shown for origin exports and imports cover both goods produced/used within the state as well as goods aggregated by businesses within the state for export or shipment to other states.
The Top 10 Exports to both countries in 2021 are shown in the following tables.
The Top 10 Imports for 2021 are as follows.
California began importing oil from Russia beginning in 2007 as in-state production declined and as shipments from Alaska were dropping as well. Currently, about 5% of the state’s crude oil imports come from Russia. In 2007, average California oil production (including federal offshore) was 598,7000 barrels a day, dropping to 357,900 barrels in the latest data for 2021. In contrast, US Energy Information Administration data shows imports of Russian crude oil in 2021 were only 42,400 barrels a day, an amount that could have been easily offset by policies ensuring California produced more of its ongoing energy needs, both now and during the extended period required to meet the state’s “clean” energy goals.
Nationally, there is more than enough current production to make up for this amount, but there are no oil pipelines connecting the state to the national markets. In addition, Jones Act restrictions make it uneconomic to ship oil to the state (and the Northeast states as well) from the Gulf Coast. Consequently, California’s continued oil demands will instead likely be handled by other import sources rather than domestic production and the associated jobs.
Share of Goods Through US Ports 17.0% CA Share of Total Trade
Through US Ports
The share of total US goods trade (exports and imports) through California ports continued its downward trend to 17.01% (12 month moving average; compared to 17.07% in December 2021 and 18.01% in January 2021).
California remained the #2 state, behind Texas with 18.14% (compared to 18.03% in December 2021 and 16.83% in January 2021). Trade through the Atlantic port states was at 30.17% (compared to 30.23% in December 2021 and 30.68% in January 2021).
California Goods Exports $0.6 Billion Change in Exports
Total California goods exports were up $0.6 billion from January 2021 (up 4.5%). California remained in 2nd place with 9.91% of all US goods exports (12 month moving total), behind Texas at 21.62%.
California's Balance for Goods Trade -$26.9 Billion of Goods Trade
California’s balance of goods trade activity through state businesses broadened to -$26.9 billion, compared to a level of -$20.2 billion in January 2021. California trade accounted for 27% of the US trade deficit in goods in January 2022.
Top 20 Exports, January 2022
Top 20 exports by value are shown below, along with the change from January 2021.
Top 10 Export Markets, January 2022 View This Report Online [[link removed]] The California Center for Jobs and the Economy provides an objective and definitive source of information pertaining to job creation and economic trends in California. [[link removed]] Contact 1301 I Street Sacramento, CA 95814 916.553.4093 If you no longer wish to receive these emails, select here to unsubscribe. [link removed]
for January 2022
Below are highlights from the recently released trade data from the US Census Bureau and US Bureau of Economic Analysis. To view additional data and analysis related to the California economy visit our website at www.[[link removed]].
In nominal terms, the January 2022 results show both California exports and trade flows through the state’s ports back to or above the pre-pandemic January 2020 levels. In real terms, however, as measured by the CPI, export levels and flows remain down, while the overall numbers remain dominated by a steep rise in imports.
Port congestion remains high but easing from the peak backup of 109 container vessels recorded for the Ports of Los Angeles and Long Beach on January 9. On October 20, 2021 when the state issued its measures [[link removed]] to tackle the ongoing supply chain issues, the backup was at 71 container ships and 108 total ships at anchor or loitering off the ports. In the latest numbers [[link removed]] for March 4, the total container ship backup was 56.
While congestion at the ports and at other points in the California and national supply chains continue as significant barriers to normal trade flows and major contributors to growing inflation, these issues are not unique to the state. In the map below indicating the port congestion at the end of February, a large number of choke points remain in the global trade networks in addition to those on the West Coast.
Source: Port Congestion Contagion Spreads, Splash, February 25, 2022
The ongoing supply chain disruptions are now joined by the as yet unknown effects coming from the Russian invasion of Ukraine and the subsequent rounds of sanctions on Russia. California trade with both countries is relatively low, comprising less than half a percent of the total through the state’s businesses. With the exception of imports from Russia, trade levels also have not changed substantially from the pre-pandemic period in 2019. Note that in both cases, the values shown for origin exports and imports cover both goods produced/used within the state as well as goods aggregated by businesses within the state for export or shipment to other states.
The Top 10 Exports to both countries in 2021 are shown in the following tables.
The Top 10 Imports for 2021 are as follows.
California began importing oil from Russia beginning in 2007 as in-state production declined and as shipments from Alaska were dropping as well. Currently, about 5% of the state’s crude oil imports come from Russia. In 2007, average California oil production (including federal offshore) was 598,7000 barrels a day, dropping to 357,900 barrels in the latest data for 2021. In contrast, US Energy Information Administration data shows imports of Russian crude oil in 2021 were only 42,400 barrels a day, an amount that could have been easily offset by policies ensuring California produced more of its ongoing energy needs, both now and during the extended period required to meet the state’s “clean” energy goals.
Nationally, there is more than enough current production to make up for this amount, but there are no oil pipelines connecting the state to the national markets. In addition, Jones Act restrictions make it uneconomic to ship oil to the state (and the Northeast states as well) from the Gulf Coast. Consequently, California’s continued oil demands will instead likely be handled by other import sources rather than domestic production and the associated jobs.
Share of Goods Through US Ports 17.0% CA Share of Total Trade
Through US Ports
The share of total US goods trade (exports and imports) through California ports continued its downward trend to 17.01% (12 month moving average; compared to 17.07% in December 2021 and 18.01% in January 2021).
California remained the #2 state, behind Texas with 18.14% (compared to 18.03% in December 2021 and 16.83% in January 2021). Trade through the Atlantic port states was at 30.17% (compared to 30.23% in December 2021 and 30.68% in January 2021).
California Goods Exports $0.6 Billion Change in Exports
Total California goods exports were up $0.6 billion from January 2021 (up 4.5%). California remained in 2nd place with 9.91% of all US goods exports (12 month moving total), behind Texas at 21.62%.
California's Balance for Goods Trade -$26.9 Billion of Goods Trade
California’s balance of goods trade activity through state businesses broadened to -$26.9 billion, compared to a level of -$20.2 billion in January 2021. California trade accounted for 27% of the US trade deficit in goods in January 2022.
Top 20 Exports, January 2022
Top 20 exports by value are shown below, along with the change from January 2021.
Top 10 Export Markets, January 2022 View This Report Online [[link removed]] The California Center for Jobs and the Economy provides an objective and definitive source of information pertaining to job creation and economic trends in California. [[link removed]] Contact 1301 I Street Sacramento, CA 95814 916.553.4093 If you no longer wish to receive these emails, select here to unsubscribe. [link removed]
Message Analysis
- Sender: California Center for Jobs and the Economy
- Political Party: n/a
- Country: United States
- State/Locality: California
- Office: n/a
-
Email Providers:
- Campaign Monitor