| From | Center for Jobs and the Economy <[email protected]> |
| Subject | California Trade Report for December 2021 |
| Date | February 8, 2022 11:45 PM |
Links have been removed from this email. Learn more in the FAQ.
Links have been removed from this email. Learn more in the FAQ.
Web Version [link removed] | Update Preferences [link removed] [link removed] California Trade Report
for December 2021
Below are highlights from the recently released trade data from the US Census Bureau and US Bureau of Economic Analysis. To view additional data and analysis related to the California economy visit our website at www.centerforjobs.org/ca.
In nominal terms, California origin exports exceeded the pre-pandemic 2019 levels for the 4th month in a row. In real terms, however, the numbers continue to show a decline.
Import activity through the state’s ports remained high as companies rebuild inventories and as shipments adjust to the Lunar New Year holiday period production shutdowns. Measured by value, imports through the ports were up 21.6% compared to the pre-pandemic period in December 2019, the 5th month in a row for double-digit gains. Congestion within the ports and subsequent blockages in other parts of the supply chain, however, remain a constraint on goods movement potential. Measured in TEUs (twenty-foot equivalent unit), loaded import container activity in the Ports of Los Angeles and Long Beach compared to the same month in 2019 actually dropped for the 4th month in a row, with December down 14.2%.
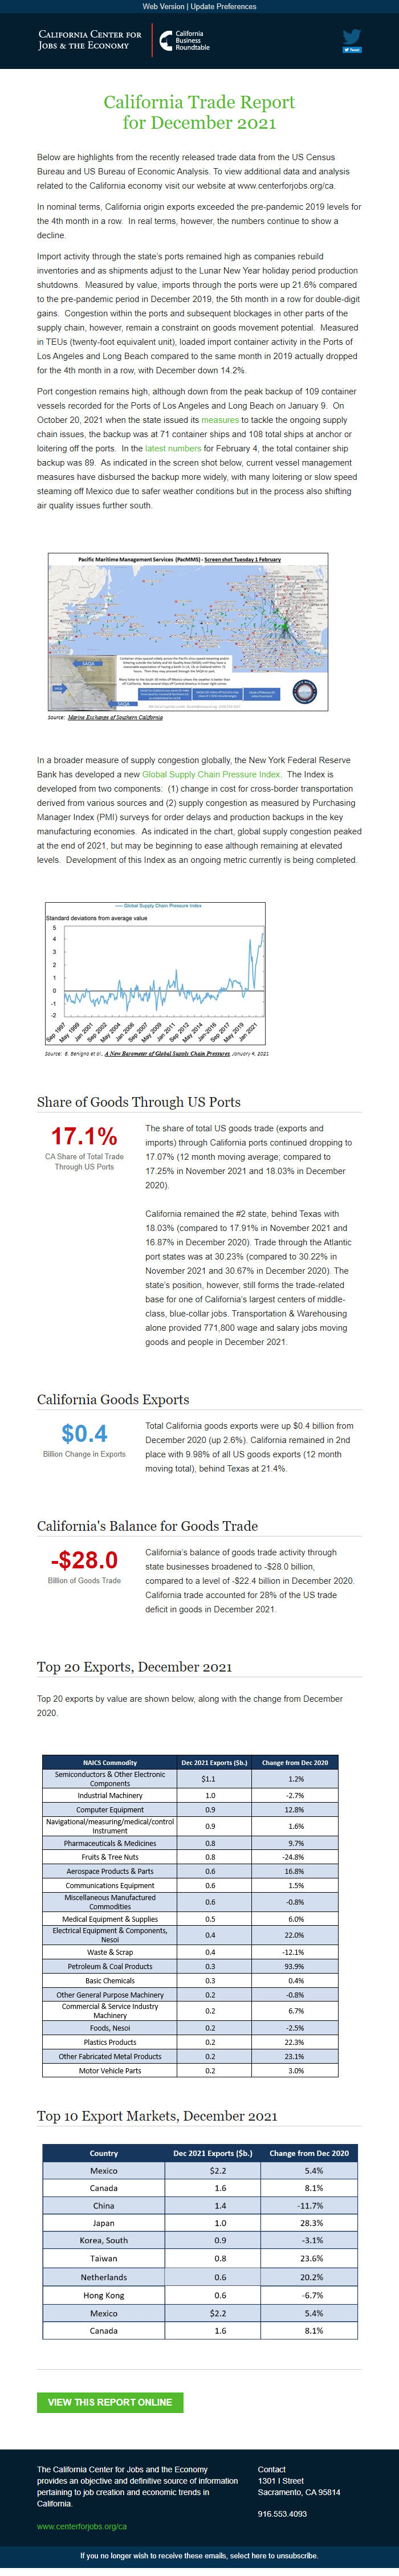
Port congestion remains high, although down from the peak backup of 109 container vessels recorded for the Ports of Los Angeles and Long Beach on January 9. On October 20, 2021 when the state issued its measures [[link removed]] to tackle the ongoing supply chain issues, the backup was at 71 container ships and 108 total ships at anchor or loitering off the ports. In the latest numbers [[link removed]] for February 4, the total container ship backup was 89. As indicated in the screen shot below, current vessel management measures have disbursed the backup more widely, with many loitering or slow speed steaming off Mexico due to safer weather conditions but in the process also shifting air quality issues further south.
In a broader measure of supply congestion globally, the New York Federal Reserve Bank has developed a new Global Supply Chain Pressure Index [[link removed]]. The Index is developed from two components: (1) change in cost for cross-border transportation derived from various sources and (2) supply congestion as measured by Purchasing Manager Index (PMI) surveys for order delays and production backups in the key manufacturing economies. As indicated in the chart, global supply congestion peaked at the end of 2021, but may be beginning to ease although remaining at elevated levels. Development of this Index as an ongoing metric currently is being completed.
Share of Goods Through US Ports 17.1% CA Share of Total Trade
Through US Ports
The share of total US goods trade (exports and imports) through California ports continued dropping to 17.07% (12 month moving average; compared to 17.25% in November 2021 and 18.03% in December 2020).
California remained the #2 state, behind Texas with 18.03% (compared to 17.91% in November 2021 and 16.87% in December 2020). Trade through the Atlantic port states was at 30.23% (compared to 30.22% in November 2021 and 30.67% in December 2020). The state’s position, however, still forms the trade-related base for one of California’s largest centers of middle-class, blue-collar jobs. Transportation & Warehousing alone provided 771,800 wage and salary jobs moving goods and people in December 2021.
California Goods Exports $0.4 Billion Change in Exports
Total California goods exports were up $0.4 billion from December 2020 (up 2.6%). California remained in 2nd place with 9.98% of all US goods exports (12 month moving total), behind Texas at 21.4%.
California's Balance for Goods Trade -$28.0 Billion of Goods Trade
California’s balance of goods trade activity through state businesses broadened to -$28.0 billion, compared to a level of -$22.4 billion in December 2020. California trade accounted for 28% of the US trade deficit in goods in December 2021.
Top 20 Exports, December 2021
Top 20 exports by value are shown below, along with the change from December 2020.
Top 10 Export Markets, December 2021 View This Report Online [[link removed]] The California Center for Jobs and the Economy provides an objective and definitive source of information pertaining to job creation and economic trends in California. [[link removed]] Contact 1301 I Street Sacramento, CA 95814 916.553.4093 If you no longer wish to receive these emails, select here to unsubscribe. [link removed]
for December 2021
Below are highlights from the recently released trade data from the US Census Bureau and US Bureau of Economic Analysis. To view additional data and analysis related to the California economy visit our website at www.centerforjobs.org/ca.
In nominal terms, California origin exports exceeded the pre-pandemic 2019 levels for the 4th month in a row. In real terms, however, the numbers continue to show a decline.
Import activity through the state’s ports remained high as companies rebuild inventories and as shipments adjust to the Lunar New Year holiday period production shutdowns. Measured by value, imports through the ports were up 21.6% compared to the pre-pandemic period in December 2019, the 5th month in a row for double-digit gains. Congestion within the ports and subsequent blockages in other parts of the supply chain, however, remain a constraint on goods movement potential. Measured in TEUs (twenty-foot equivalent unit), loaded import container activity in the Ports of Los Angeles and Long Beach compared to the same month in 2019 actually dropped for the 4th month in a row, with December down 14.2%.
Port congestion remains high, although down from the peak backup of 109 container vessels recorded for the Ports of Los Angeles and Long Beach on January 9. On October 20, 2021 when the state issued its measures [[link removed]] to tackle the ongoing supply chain issues, the backup was at 71 container ships and 108 total ships at anchor or loitering off the ports. In the latest numbers [[link removed]] for February 4, the total container ship backup was 89. As indicated in the screen shot below, current vessel management measures have disbursed the backup more widely, with many loitering or slow speed steaming off Mexico due to safer weather conditions but in the process also shifting air quality issues further south.
In a broader measure of supply congestion globally, the New York Federal Reserve Bank has developed a new Global Supply Chain Pressure Index [[link removed]]. The Index is developed from two components: (1) change in cost for cross-border transportation derived from various sources and (2) supply congestion as measured by Purchasing Manager Index (PMI) surveys for order delays and production backups in the key manufacturing economies. As indicated in the chart, global supply congestion peaked at the end of 2021, but may be beginning to ease although remaining at elevated levels. Development of this Index as an ongoing metric currently is being completed.
Share of Goods Through US Ports 17.1% CA Share of Total Trade
Through US Ports
The share of total US goods trade (exports and imports) through California ports continued dropping to 17.07% (12 month moving average; compared to 17.25% in November 2021 and 18.03% in December 2020).
California remained the #2 state, behind Texas with 18.03% (compared to 17.91% in November 2021 and 16.87% in December 2020). Trade through the Atlantic port states was at 30.23% (compared to 30.22% in November 2021 and 30.67% in December 2020). The state’s position, however, still forms the trade-related base for one of California’s largest centers of middle-class, blue-collar jobs. Transportation & Warehousing alone provided 771,800 wage and salary jobs moving goods and people in December 2021.
California Goods Exports $0.4 Billion Change in Exports
Total California goods exports were up $0.4 billion from December 2020 (up 2.6%). California remained in 2nd place with 9.98% of all US goods exports (12 month moving total), behind Texas at 21.4%.
California's Balance for Goods Trade -$28.0 Billion of Goods Trade
California’s balance of goods trade activity through state businesses broadened to -$28.0 billion, compared to a level of -$22.4 billion in December 2020. California trade accounted for 28% of the US trade deficit in goods in December 2021.
Top 20 Exports, December 2021
Top 20 exports by value are shown below, along with the change from December 2020.
Top 10 Export Markets, December 2021 View This Report Online [[link removed]] The California Center for Jobs and the Economy provides an objective and definitive source of information pertaining to job creation and economic trends in California. [[link removed]] Contact 1301 I Street Sacramento, CA 95814 916.553.4093 If you no longer wish to receive these emails, select here to unsubscribe. [link removed]
Message Analysis
- Sender: California Center for Jobs and the Economy
- Political Party: n/a
- Country: United States
- State/Locality: California
- Office: n/a
-
Email Providers:
- Campaign Monitor