| From | Center for Jobs and the Economy <[email protected]> |
| Subject | California Trade Report for November 2021 |
| Date | January 6, 2022 11:21 PM |
Links have been removed from this email. Learn more in the FAQ.
Links have been removed from this email. Learn more in the FAQ.
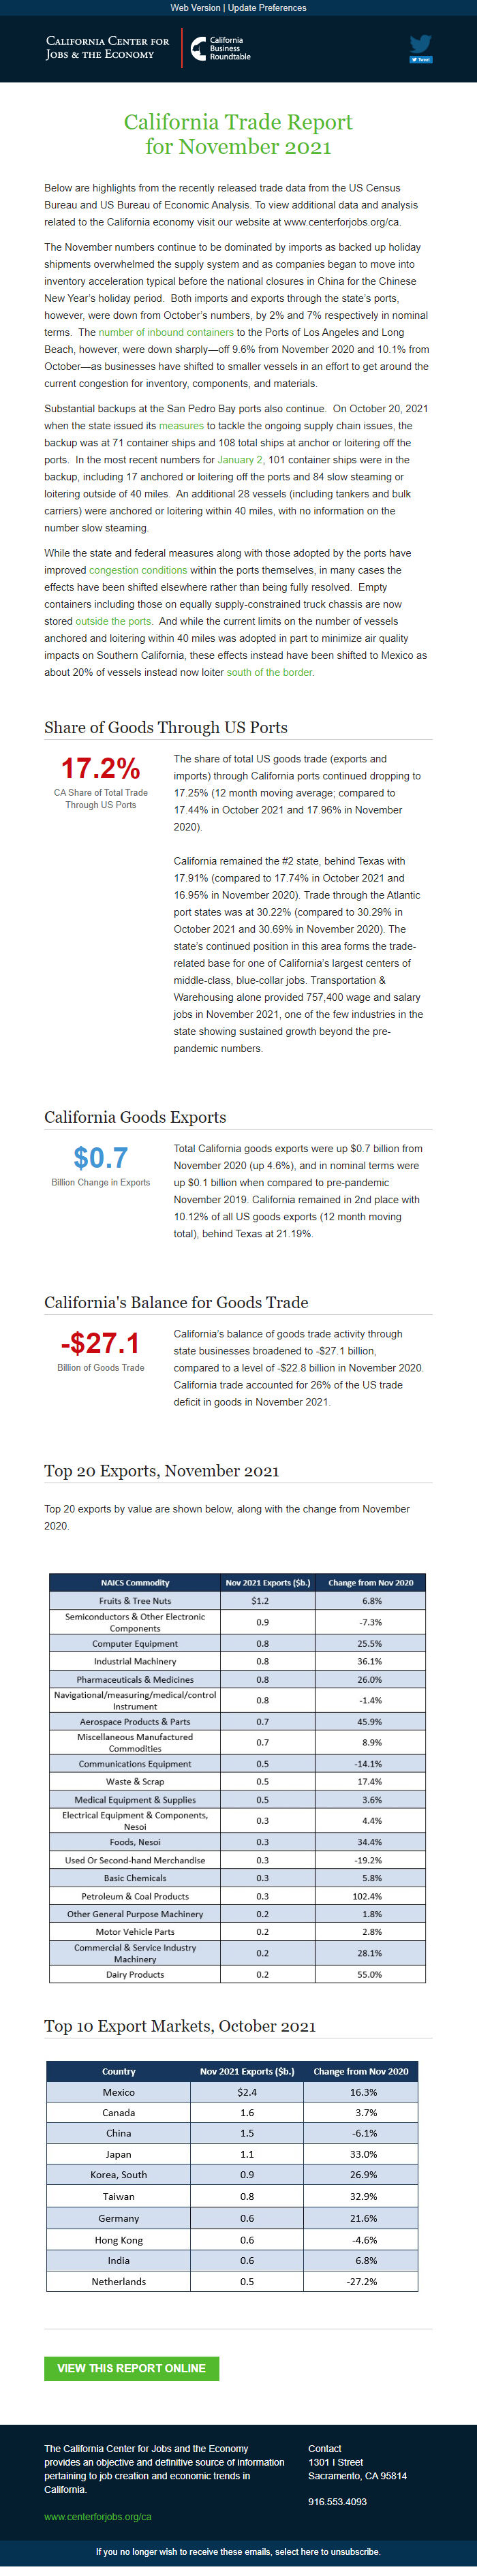
Web Version [link removed] | Update Preferences [link removed] [link removed] California Trade Report
for November 2021
Below are highlights from the recently released trade data from the US Census Bureau and US Bureau of Economic Analysis. To view additional data and analysis related to the California economy visit our website at www.centerforjobs.org/ca.
The November numbers continue to be dominated by imports as backed up holiday shipments overwhelmed the supply system and as companies began to move into inventory acceleration typical before the national closures in China for the Chinese New Year’s holiday period. Both imports and exports through the state’s ports, however, were down from October’s numbers, by 2% and 7% respectively in nominal terms. The number of inbound containers [[link removed]] to the Ports of Los Angeles and Long Beach, however, were down sharply—off 9.6% from November 2020 and 10.1% from October—as businesses have shifted to smaller vessels in an effort to get around the current congestion for inventory, components, and materials.
Substantial backups at the San Pedro Bay ports also continue. On October 20, 2021 when the state issued its measures [[link removed]] to tackle the ongoing supply chain issues, the backup was at 71 container ships and 108 total ships at anchor or loitering off the ports. In the most recent numbers for January 2 [[link removed]], 101 container ships were in the backup, including 17 anchored or loitering off the ports and 84 slow steaming or loitering outside of 40 miles. An additional 28 vessels (including tankers and bulk carriers) were anchored or loitering within 40 miles, with no information on the number slow steaming.
While the state and federal measures along with those adopted by the ports have improved congestion conditions [[link removed]] within the ports themselves, in many cases the effects have been shifted elsewhere rather than being fully resolved. Empty containers including those on equally supply-constrained truck chassis are now stored outside the ports [[link removed]]. And while the current limits on the number of vessels anchored and loitering within 40 miles was adopted in part to minimize air quality impacts on Southern California, these effects instead have been shifted to Mexico as about 20% of vessels instead now loiter south of the border [[link removed]].
Share of Goods Through US Ports 17.2% CA Share of Total Trade
Through US Ports
The share of total US goods trade (exports and imports) through California ports continued dropping to 17.25% (12 month moving average; compared to 17.44% in October 2021 and 17.96% in November 2020).
California remained the #2 state, behind Texas with 17.91% (compared to 17.74% in October 2021 and 16.95% in November 2020). Trade through the Atlantic port states was at 30.22% (compared to 30.29% in October 2021 and 30.69% in November 2020). The state’s continued position in this area forms the trade-related base for one of California’s largest centers of middle-class, blue-collar jobs. Transportation & Warehousing alone provided 757,400 wage and salary jobs in November 2021, one of the few industries in the state showing sustained growth beyond the pre-pandemic numbers.
California Goods Exports $0.7 Billion Change in Exports
Total California goods exports were up $0.7 billion from November 2020 (up 4.6%), and in nominal terms were up $0.1 billion when compared to pre-pandemic November 2019. California remained in 2nd place with 10.12% of all US goods exports (12 month moving total), behind Texas at 21.19%.
California's Balance for Goods Trade -$27.1 Billion of Goods Trade
California’s balance of goods trade activity through state businesses broadened to -$27.1 billion, compared to a level of -$22.8 billion in November 2020. California trade accounted for 26% of the US trade deficit in goods in November 2021.
Top 20 Exports, November 2021
Top 20 exports by value are shown below, along with the change from November 2020.
Top 10 Export Markets, October 2021 View This Report Online [[link removed]] The California Center for Jobs and the Economy provides an objective and definitive source of information pertaining to job creation and economic trends in California. [[link removed]] Contact 1301 I Street Sacramento, CA 95814 916.553.4093 If you no longer wish to receive these emails, select here to unsubscribe. [link removed]
Message Analysis
- Sender: California Center for Jobs and the Economy
- Political Party: n/a
- Country: United States
- State/Locality: California
- Office: n/a
-
Email Providers:
- Campaign Monitor