| From | Center for Jobs and the Economy <[email protected]> |
| Subject | California Trade Report for October 2021 |
| Date | December 8, 2021 12:15 AM |
Links have been removed from this email. Learn more in the FAQ.
Links have been removed from this email. Learn more in the FAQ.
Web Version [link removed] | Update Preferences [link removed] [link removed] California Trade Report
for October 2021
Below are highlights from the recently released trade data from the US Census Bureau and US Bureau of Economic Analysis. To view additional data and analysis related to the California economy visit our website at www.centerforjobs.org/ca.
October continued the surge in trade activity as shipping for the holidays and rebuilding depleted goods and components inventories remained high along with an expansion in state exports. Total trade through the state’s ports was at its second highest monthly level in the data since 2003 as were state origin exports. State destination imports were at their 3rd highest. Note that both the export and import numbers include goods produced/used within the state as well as those consolidated in the state for shipment from/to other states. These numbers, however, incorporate different job center activities within the state and consequently are the preferred measure for the purposes of the Center.
These rankings are based on nominal values. Adjusting to real values that incorporate the growing inflation costs would place the rankings lower. The numbers while substantially improving indicate that exports in particular but overall trade as well is only beginning to return to pre-pandemic levels. The state has yet to experience substantial growth that would assist in its lagging economic recovery rate.Measured on a 12-month running total as in the chart below, the October results indicate exports have largely returned to pre-pandemic 2019 levels, but have yet to exceed prior peaks.
Overall trade activity remains hindered by blockages within the supply chain, including both the transport of materials, components, and finished goods and production disruptions caused by these delays along with renewed concerns over the Omicron variant. To cope with the growing congestion, the shipping industry recently introduced a new process to reduce the number of ships within a 40-mile Safety and Air Quality Area [[link removed]] (SAQA) around the ports of Los Angeles and Long Beach during the winter weather months. Inbound ships are now subject to reduced steaming speeds and loitering outside the SAQA area.
Comparing to October 20 when the state issued its measures [[link removed]] to tackle the supply chain issues, overall port congestion remains elevated. On October 20, there were 71 container ships and 108 total ships at anchor or loitering off the ports. In the most recent results for December 6 [[link removed]], there were 68 ships at anchor or loitering within the SACA zone, of which 35 were container ships. In addition, there were another 59 container ships loitering or slow steaming outside the SACA, for a total of 94 container ships in the current backup.
Due to the supply chain problems, deliveries remain slowed throughout the economy. Institute of Supply Management (ISM) reported [[link removed]] its November Supplier Deliveries Index for Services was unchanged from October at 75.7, the second highest level ever (an Index over 50 indicates supply deliveries are slowing; below 50 that delivery times are improving). The Supplier Deliveries Index for Manufacturing was also elevated at 72.2 but was slightly improved over October, indicating that delays are still growing but at a somewhat lower pace.
Other ISM indicators show only limited progress in resolving the current supply crunch. Their Backlog of Orders index was also growing for both Services and Manufacturing [[link removed]], but at a slower pace than in prior months. Prices also continue to increase, but again at a slower pace. These two indices are the inverse of the Supplier Deliveries—an Index over 50 indicates that backlog/prices are increasing. The results indicate, however, that both the federal and state actions announced in October have yet to produce substantial relief to the supply chain disruptions.
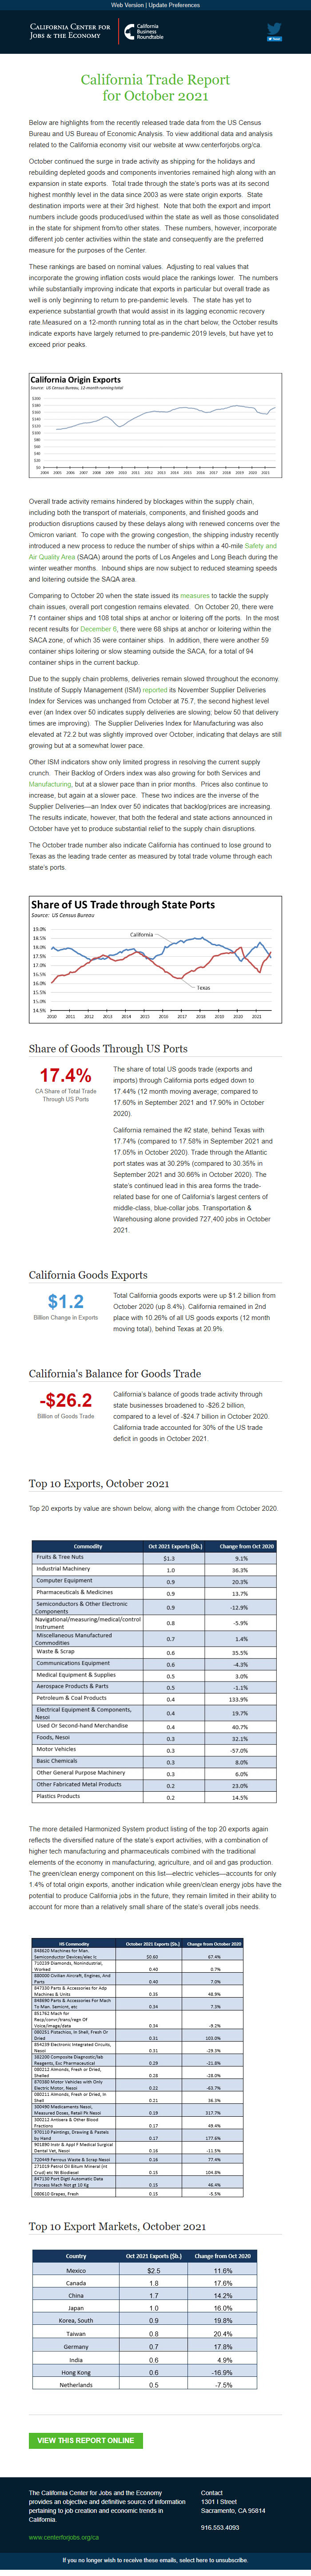
The October trade number also indicate California has continued to lose ground to Texas as the leading trade center as measured by total trade volume through each state’s ports.
Share of Goods Through US Ports 17.4% CA Share of Total Trade
Through US Ports
The share of total US goods trade (exports and imports) through California ports edged down to 17.44% (12 month moving average; compared to 17.60% in September 2021 and 17.90% in October 2020).
California remained the #2 state, behind Texas with 17.74% (compared to 17.58% in September 2021 and 17.05% in October 2020). Trade through the Atlantic port states was at 30.29% (compared to 30.35% in September 2021 and 30.66% in October 2020). The state’s continued lead in this area forms the trade-related base for one of California’s largest centers of middle-class, blue-collar jobs. Transportation & Warehousing alone provided 727,400 jobs in October 2021.
California Goods Exports $1.2 Billion Change in Exports
Total California goods exports were up $1.2 billion from October 2020 (up 8.4%). California remained in 2nd place with 10.26% of all US goods exports (12 month moving total), behind Texas at 20.9%.
California's Balance for Goods Trade -$26.2 Billion of Goods Trade
California’s balance of goods trade activity through state businesses broadened to -$26.2 billion, compared to a level of -$24.7 billion in October 2020. California trade accounted for 30% of the US trade deficit in goods in October 2021.
Top 10 Exports, October 2021
Top 20 exports by value are shown below, along with the change from October 2020.
The more detailed Harmonized System product listing of the top 20 exports again reflects the diversified nature of the state’s export activities, with a combination of higher tech manufacturing and pharmaceuticals combined with the traditional elements of the economy in manufacturing, agriculture, and oil and gas production. The green/clean energy component on this list—electric vehicles—accounts for only 1.4% of total origin exports, another indication while green/clean energy jobs have the potential to produce California jobs in the future, they remain limited in their ability to account for more than a relatively small share of the state’s overall jobs needs.
Top 10 Export Markets, October 2021 View This Report Online [[link removed]] The California Center for Jobs and the Economy provides an objective and definitive source of information pertaining to job creation and economic trends in California. [[link removed]] Contact 1301 I Street Sacramento, CA 95814 916.553.4093 If you no longer wish to receive these emails, select here to unsubscribe. [link removed]
for October 2021
Below are highlights from the recently released trade data from the US Census Bureau and US Bureau of Economic Analysis. To view additional data and analysis related to the California economy visit our website at www.centerforjobs.org/ca.
October continued the surge in trade activity as shipping for the holidays and rebuilding depleted goods and components inventories remained high along with an expansion in state exports. Total trade through the state’s ports was at its second highest monthly level in the data since 2003 as were state origin exports. State destination imports were at their 3rd highest. Note that both the export and import numbers include goods produced/used within the state as well as those consolidated in the state for shipment from/to other states. These numbers, however, incorporate different job center activities within the state and consequently are the preferred measure for the purposes of the Center.
These rankings are based on nominal values. Adjusting to real values that incorporate the growing inflation costs would place the rankings lower. The numbers while substantially improving indicate that exports in particular but overall trade as well is only beginning to return to pre-pandemic levels. The state has yet to experience substantial growth that would assist in its lagging economic recovery rate.Measured on a 12-month running total as in the chart below, the October results indicate exports have largely returned to pre-pandemic 2019 levels, but have yet to exceed prior peaks.
Overall trade activity remains hindered by blockages within the supply chain, including both the transport of materials, components, and finished goods and production disruptions caused by these delays along with renewed concerns over the Omicron variant. To cope with the growing congestion, the shipping industry recently introduced a new process to reduce the number of ships within a 40-mile Safety and Air Quality Area [[link removed]] (SAQA) around the ports of Los Angeles and Long Beach during the winter weather months. Inbound ships are now subject to reduced steaming speeds and loitering outside the SAQA area.
Comparing to October 20 when the state issued its measures [[link removed]] to tackle the supply chain issues, overall port congestion remains elevated. On October 20, there were 71 container ships and 108 total ships at anchor or loitering off the ports. In the most recent results for December 6 [[link removed]], there were 68 ships at anchor or loitering within the SACA zone, of which 35 were container ships. In addition, there were another 59 container ships loitering or slow steaming outside the SACA, for a total of 94 container ships in the current backup.
Due to the supply chain problems, deliveries remain slowed throughout the economy. Institute of Supply Management (ISM) reported [[link removed]] its November Supplier Deliveries Index for Services was unchanged from October at 75.7, the second highest level ever (an Index over 50 indicates supply deliveries are slowing; below 50 that delivery times are improving). The Supplier Deliveries Index for Manufacturing was also elevated at 72.2 but was slightly improved over October, indicating that delays are still growing but at a somewhat lower pace.
Other ISM indicators show only limited progress in resolving the current supply crunch. Their Backlog of Orders index was also growing for both Services and Manufacturing [[link removed]], but at a slower pace than in prior months. Prices also continue to increase, but again at a slower pace. These two indices are the inverse of the Supplier Deliveries—an Index over 50 indicates that backlog/prices are increasing. The results indicate, however, that both the federal and state actions announced in October have yet to produce substantial relief to the supply chain disruptions.
The October trade number also indicate California has continued to lose ground to Texas as the leading trade center as measured by total trade volume through each state’s ports.
Share of Goods Through US Ports 17.4% CA Share of Total Trade
Through US Ports
The share of total US goods trade (exports and imports) through California ports edged down to 17.44% (12 month moving average; compared to 17.60% in September 2021 and 17.90% in October 2020).
California remained the #2 state, behind Texas with 17.74% (compared to 17.58% in September 2021 and 17.05% in October 2020). Trade through the Atlantic port states was at 30.29% (compared to 30.35% in September 2021 and 30.66% in October 2020). The state’s continued lead in this area forms the trade-related base for one of California’s largest centers of middle-class, blue-collar jobs. Transportation & Warehousing alone provided 727,400 jobs in October 2021.
California Goods Exports $1.2 Billion Change in Exports
Total California goods exports were up $1.2 billion from October 2020 (up 8.4%). California remained in 2nd place with 10.26% of all US goods exports (12 month moving total), behind Texas at 20.9%.
California's Balance for Goods Trade -$26.2 Billion of Goods Trade
California’s balance of goods trade activity through state businesses broadened to -$26.2 billion, compared to a level of -$24.7 billion in October 2020. California trade accounted for 30% of the US trade deficit in goods in October 2021.
Top 10 Exports, October 2021
Top 20 exports by value are shown below, along with the change from October 2020.
The more detailed Harmonized System product listing of the top 20 exports again reflects the diversified nature of the state’s export activities, with a combination of higher tech manufacturing and pharmaceuticals combined with the traditional elements of the economy in manufacturing, agriculture, and oil and gas production. The green/clean energy component on this list—electric vehicles—accounts for only 1.4% of total origin exports, another indication while green/clean energy jobs have the potential to produce California jobs in the future, they remain limited in their ability to account for more than a relatively small share of the state’s overall jobs needs.
Top 10 Export Markets, October 2021 View This Report Online [[link removed]] The California Center for Jobs and the Economy provides an objective and definitive source of information pertaining to job creation and economic trends in California. [[link removed]] Contact 1301 I Street Sacramento, CA 95814 916.553.4093 If you no longer wish to receive these emails, select here to unsubscribe. [link removed]
Message Analysis
- Sender: California Center for Jobs and the Economy
- Political Party: n/a
- Country: United States
- State/Locality: California
- Office: n/a
-
Email Providers:
- Campaign Monitor