| From | Center for Jobs and the Economy <[email protected]> |
| Subject | California Energy Price Data for October 2021 |
| Date | November 5, 2021 11:30 PM |
Links have been removed from this email. Learn more in the FAQ.
Links have been removed from this email. Learn more in the FAQ.
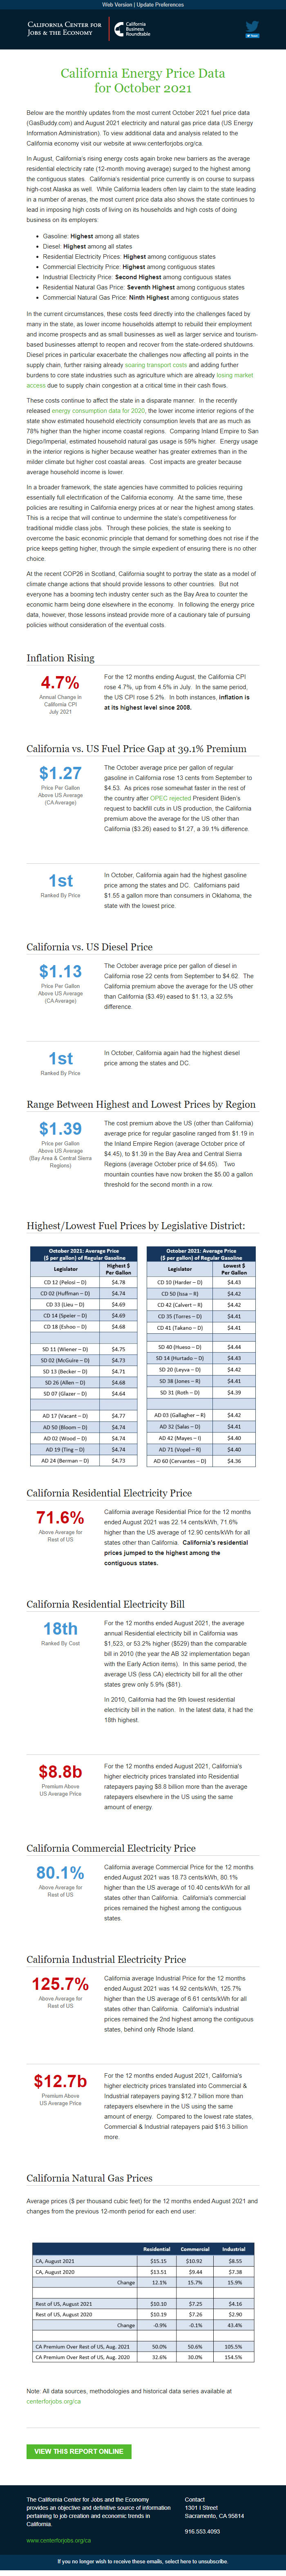
Web Version [link removed] | Update Preferences [link removed] [link removed] California Energy Price Data
for October 2021
Below are the monthly updates from the most current October 2021 fuel price data (GasBuddy.com) and August 2021 electricity and natural gas price data (US Energy Information Administration). To view additional data and analysis related to the California economy visit our website at www.centerforjobs.org/ca.
In August, California’s rising energy costs again broke new barriers as the average residential electricity rate (12-month moving average) surged to the highest among the contiguous states. California’s residential price currently is on course to surpass high-cost Alaska as well. While California leaders often lay claim to the state leading in a number of arenas, the most current price data also shows the state continues to lead in imposing high costs of living on its households and high costs of doing business on its employers:
Gasoline: Highest among all states Diesel: Highest among all states Residential Electricity Prices: Highest among contiguous states Commercial Electricity Price: Highest among contiguous states Industrial Electricity Price: Second Highest among contiguous states Residential Natural Gas Price: Seventh Highest among contiguous states Commercial Natural Gas Price: Ninth Highest among contiguous states
In the current circumstances, these costs feed directly into the challenges faced by many in the state, as lower income households attempt to rebuild their employment and income prospects and as small businesses as well as larger service and tourism-based businesses attempt to reopen and recover from the state-ordered shutdowns. Diesel prices in particular exacerbate the challenges now affecting all points in the supply chain, further raising already soaring transport costs [[link removed]]and adding further burdens to core state industries such as agriculture which are already losing market access [[link removed]]due to supply chain congestion at a critical time in their cash flows.
These costs continue to affect the state in a disparate manner. In the recently released energy consumption data for 2020 [[link removed]], the lower income interior regions of the state show estimated household electricity consumption levels that are as much as 78% higher than the higher income coastal regions. Comparing Inland Empire to San Diego/Imperial, estimated household natural gas usage is 59% higher. Energy usage in the interior regions is higher because weather has greater extremes than in the milder climate but higher cost coastal areas. Cost impacts are greater because average household income is lower.
In a broader framework, the state agencies have committed to policies requiring essentially full electrification of the California economy. At the same time, these policies are resulting in California energy prices at or near the highest among states. This is a recipe that will continue to undermine the state’s competitiveness for traditional middle class jobs. Through these policies, the state is seeking to overcome the basic economic principle that demand for something does not rise if the price keeps getting higher, through the simple expedient of ensuring there is no other choice.
At the recent COP26 in Scotland, California sought to portray the state as a model of climate change actions that should provide lessons to other countries. But not everyone has a booming tech industry center such as the Bay Area to counter the economic harm being done elsewhere in the economy. In following the energy price data, however, those lessons instead provide more of a cautionary tale of pursuing policies without consideration of the eventual costs.
Inflation Rising 4.7% Annual Change in
California CPI
July 2021
For the 12 months ending August, the California CPI rose 4.7%, up from 4.5% in July. In the same period, the US CPI rose 5.2%. In both instances, inflation is at its highest level since 2008.
California vs. US Fuel Price Gap at 39.1% Premium $1.27 Price Per Gallon
Above US Average
(CA Average)
The October average price per gallon of regular gasoline in California rose 13 cents from September to $4.53. As prices rose somewhat faster in the rest of the country after OPEC rejected [[link removed]] President Biden’s request to backfill cuts in US production, the California premium above the average for the US other than California ($3.26) eased to $1.27, a 39.1% difference.
1st Ranked By Price
In October, California again had the highest gasoline price among the states and DC. Californians paid $1.55 a gallon more than consumers in Oklahoma, the state with the lowest price.
California vs. US Diesel Price $1.13 Price Per Gallon
Above US Average
(CA Average)
The October average price per gallon of diesel in California rose 22 cents from September to $4.62. The California premium above the average for the US other than California ($3.49) eased to $1.13, a 32.5% difference.
1st Ranked By Price
In October, California again had the highest diesel price among the states and DC.
Range Between Highest and Lowest Prices by Region $1.39 Price per Gallon
Above US Average
(Bay Area & Central Sierra Regions)
The cost premium above the US (other than California) average price for regular gasoline ranged from $1.19 in the Inland Empire Region (average October price of $4.45), to $1.39 in the Bay Area and Central Sierra Regions (average October price of $4.65). Two mountain counties have now broken the $5.00 a gallon threshold for the second month in a row.
Highest/Lowest Fuel Prices by Legislative District: California Residential Electricity Price 71.6% Above Average for
Rest of US
California average Residential Price for the 12 months ended August 2021 was 22.14 cents/kWh, 71.6% higher than the US average of 12.90 cents/kWh for all states other than California. California's residential prices jumped to the highest among the contiguous states.
California Residential Electricity Bill 18th Ranked By Cost
For the 12 months ended August 2021, the average annual Residential electricity bill in California was $1,523, or 53.2% higher ($529) than the comparable bill in 2010 (the year the AB 32 implementation began with the Early Action items). In this same period, the average US (less CA) electricity bill for all the other states grew only 5.9% ($81).
In 2010, California had the 9th lowest residential electricity bill in the nation. In the latest data, it had the 18th highest.
$8.8b Premium Above
US Average Price
For the 12 months ended August 2021, California's higher electricity prices translated into Residential ratepayers paying $8.8 billion more than the average ratepayers elsewhere in the US using the same amount of energy.
California Commercial Electricity Price 80.1% Above Average for
Rest of US
California average Commercial Price for the 12 months ended August 2021 was 18.73 cents/kWh, 80.1% higher than the US average of 10.40 cents/kWh for all states other than California. California's commercial prices remained the highest among the contiguous states.
California Industrial Electricity Price 125.7% Above Average for
Rest of US
California average Industrial Price for the 12 months ended August 2021 was 14.92 cents/kWh, 125.7% higher than the US average of 6.61 cents/kWh for all states other than California. California's industrial prices remained the 2nd highest among the contiguous states, behind only Rhode Island.
$12.7b Premium Above
US Average Price
For the 12 months ended August 2021, California's higher electricity prices translated into Commercial & Industrial ratepayers paying $12.7 billion more than ratepayers elsewhere in the US using the same amount of energy. Compared to the lowest rate states, Commercial & Industrial ratepayers paid $16.3 billion more.
California Natural Gas Prices
Average prices ($ per thousand cubic feet) for the 12 months ended August 2021 and changes from the previous 12-month period for each end user:
Note: All data sources, methodologies and historical data series available at [[link removed]]
View this Report Online [[link removed]] The California Center for Jobs and the Economy provides an objective and definitive source of information pertaining to job creation and economic trends in California. [[link removed]] Contact 1301 I Street Sacramento, CA 95814 916.553.4093 If you no longer wish to receive these emails, select here to unsubscribe. [link removed]
Message Analysis
- Sender: California Center for Jobs and the Economy
- Political Party: n/a
- Country: United States
- State/Locality: California
- Office: n/a
-
Email Providers:
- Campaign Monitor