Email
Unemployment Data Update: March 2020 through October 9, 2021
| From | Center for Jobs and the Economy <[email protected]> |
| Subject | Unemployment Data Update: March 2020 through October 9, 2021 |
| Date | October 14, 2021 9:15 PM |
Links have been removed from this email. Learn more in the FAQ.
Links have been removed from this email. Learn more in the FAQ.
Web Version [link removed] | Update Preferences [link removed] [link removed] Unemployment Data Update: March 2020 through August 28, 2021 Unemployment Insurance Claims
Total initial claims fell in both California and the nation for the week of August 21.
Within the state, initial claims under the regular program were down 5.7% and dropped more broadly by 18.5% for PUA. Combined, total claims fell 11.5%, finally reversing the general rise that began in mid-July. The total, however, is still just over 50% higher than the previous low hit at the beginning of June.
Nationally, regular program claims dropped 3.7%, and PUA claims slightly slower at a 12.0% drop. Total claims were down 6.0%, bringing the total to yet another low since the PUA component began in March 2020.
Return to Work
As discussed in more detail in our Job Report [[link removed]] on the May results, most states have shifted policies in response to growing concerns that the unprecedented federal enhancements to unemployment insurance payments are a key factor in the worker shortages that threaten to hold back the speed and extent of the economic recovery while also contributing to inflationary pressures. These policy changes can be categorized within one of three groups:
Early Action States: After accounting for changes as the result of court orders in two states, 24 states halted some or all of the federal benefit enhancements prior to the September expirations, retaining the core state benefit structures as part of their ongoing safety net programs. These states generally also have reinstituted the previous job search requirements as well, while Arizona, Montana, New Hampshire, and Oklahoma have also included a “signing bonus” for those returning to a job. Oklahoma also provides up to 60 days of free child care for returning workers.
Job Search States: California and another 22 states resumed the previous job search requirements will be resumed in order for recipients to maintain benefits. Of these states, Colorado, Connecticut, and Virginia have also instituted “signing bonuses” for those returning to a job. California while technically in this category, has implemented job search requirements that are far broader [[link removed]?] than those in many other states.
No Change States: Only 4 states have not announced any related policies to accelerate the return to work.
These distinctions will largely disappear after September 4, when the federal pandemic unemployment benefit enhancements [[link removed]] mostly expire. EDD, however, has indicated that they will continue processing some claims filed covering the eligible periods.
Preliminary studies [[link removed]] of the effect of these different policies so far indicate there have been only modest differences in the rate of jobs growth between the different groups of states. The issue is not entirely clear yet for a number of reasons. First, these analyses are preliminary, taking into account only one month of data so far. Additional data will be coming in, but a number of factors are obviously in play affecting jobs results in each of the states. The precise contribution of the benefits change will be difficult to separate out as all states move beyond the September 4 deadline. Second, the analyses lump the states into only two categories, obfuscating the fact that several states instead chose to reinstate job search requirements rather than change benefit levels, introducing a policy change that substantially affects the conclusions. Third, the analyses focus on jobs, while other data indicates a strong shift—especially in other states where this option is not restricted as in California due to AB 5—to self-employment and to workers starting their own businesses. Workers still reluctant to return to a workplace setting (jobs) instead have pursued other earned income opportunities, and these numbers are reflected in the employment rather than the jobs data. Both Labor Force and Employment recovery in the recent July numbers were much further along in the Early Action states. This outcome also reflects the situation that actions on the enhanced benefits is in some respects more an indicator, as the Early Action states, in general, were already engaged in broader policy actions to get people back to work.
And fourth, regardless of the measure used, California remains well behind the other groupings. The latest week’s results finally show some improvement in the California numbers, but comparing to the week of June 12 when the Early Action state changes began going into effect still shows California initial claims rising 17.4% in this period and dropping 26.1% in the Early Action states.
While the policy response [[link removed]] from the state has been to encourage recipients to replace the expiring benefits with other public assistance programs, job openings have been rising sharply in the state as in the rest of the nation. Nationally, the latest nonfarm job openings (seasonally adjusted) in June reached 10.1 million, or a third higher than the previous peak seen in late 2018. This level was also 6% higher than the official number of unemployed workers available to fill them that month, although the skills mix in the unemployed pool does not necessarily fully conform with the requirements of the unfilled jobs.
Currently, comparable estimates from BLS for the states lag the US numbers by about 3 months but will be reported monthly beginning in October. In the meantime, other, more current data sources indicate that job openings are rising rapidly but lagging the US total by about 4-5 months—another indication of the state facing a slower recovery than the rest of the nation. As shown in the chart, Emsi [[link removed]] maintains a similar data series, but one that counts the number of job postings from various on-line sources within each month rather than unfilled job openings remaining at the end. While the national numbers have moved ahead, California job postings are now back to 2019 levels, a period when the state and nation were near full employment. In the July numbers, California had 1.391 million job postings, or just 3% lower than the number of official unemployed that month.
As discussed in our prior reports, the state actions during the pandemic had the most severe economic consequences on lower-wage jobs, and demographically saw job loss somewhat more among the young, women, and non-White workers. While the demographic information from the unemployment insurance claims data is incomplete, some additional information is available through the Current Population Survey results, although the small size of this survey generally makes annual rather than monthly or quarterly estimates more statistically valid on the state level.
Using quarterly estimates as an illustration, however, unemployment rates rose substantially across all demographics but showed a much larger increase for African-Americans compared to the same period in pre-pandemic 2019. Looking at just rates, though, can be misleading due to the interplay between the number of unemployed and the labor force base, including factors such as the shifting population mix and the accelerated retirement rate over the pandemic period among older, generally more White workers. Looking instead at the absolute numbers, the distribution across racial/ethnic groups similarly shows a higher shift in African-American unemployed and a relatively lesser effect among White unemployed, although about a third of the shift for White unemployed is the result of the underlying demographic changes in the labor force base. The other demographic groups similarly show a slight distribution shift as well, but these are generally consistent with the changes in the underlying labor force base. In all cases, however, the numbers cover only the officially unemployed—those out of work and looking for a job as generally defined by the state’s unemployment insurance job search requirements. They do not include those who have left the labor force, which in our current estimates cover about another 500,000 workers.
The distributional effects of the September 4 deadline, however, stem from the policy decisions made over the course of the pandemic. As reflected in the latest jobs numbers, California significantly lags the other states in both nonfarm jobs recovery (9th lowest) and employment recovery (8th lowest). Instead, California has relied to a greater extent on unemployment insurance as the de facto income support program for a far larger share of its workforce in this period. That program, however, was never designed for this role at this scale, and the repeated failures in terms of backlogs, applicant delays and frustration, and unparalleled fraud are only some of the indicators of this situation. The failure to date to address the $24 billion and rising debt is yet another indicator but is also one that will continue to affect the pace of jobs-oriented alternatives in the years ahead.
The effects stemming from the September 4 deadline are only part of the outcomes. While unemployment insurance provided benefits to deal with the immediate effects of the state’s pandemic strategies, there are longer-term effects to consider as well. As extensively documented, long-term unemployment is associated with lower lifetime wage, income, and employment opportunities. Other states have been far more aggressive in combating these risks by moving more quickly back to recovery levels.
Backlogs
Under their revised definition of the backlog, EDD now counts claims awaiting EDD action for more than 21 days plus claimants who are with the 30-day period to certify their eligibility for benefits. In the results for the week of August 28, the first component dropped 4.5%. The combined total was down 3.3%.
In the related call center data, overall activity continued to drop, but with the number of calls edging up 1.7% to 2.2 million and the number of answered calls dropping 2.9%. It still required an average of 9.5 calls to reach EDD.
UI Fund
In the most recent data from EDD [[link removed]], California paid out a total of $168.9 billion in benefits under all the UI programs since the week of March 7, 2020, and through the week of August 21, 2021. The most current estimate [[link removed]] from EDD is that up to $31 billion of unemployment benefits was paid out to fraudulent claims, consisting of $11 billion in known fraud and up to $20 billion in suspected fraud. Individual cases [[link removed]] continue to unfold [[link removed]]. Nationwide, current fraud total estimates range from $87 billion to $400 billion. [[link removed]]
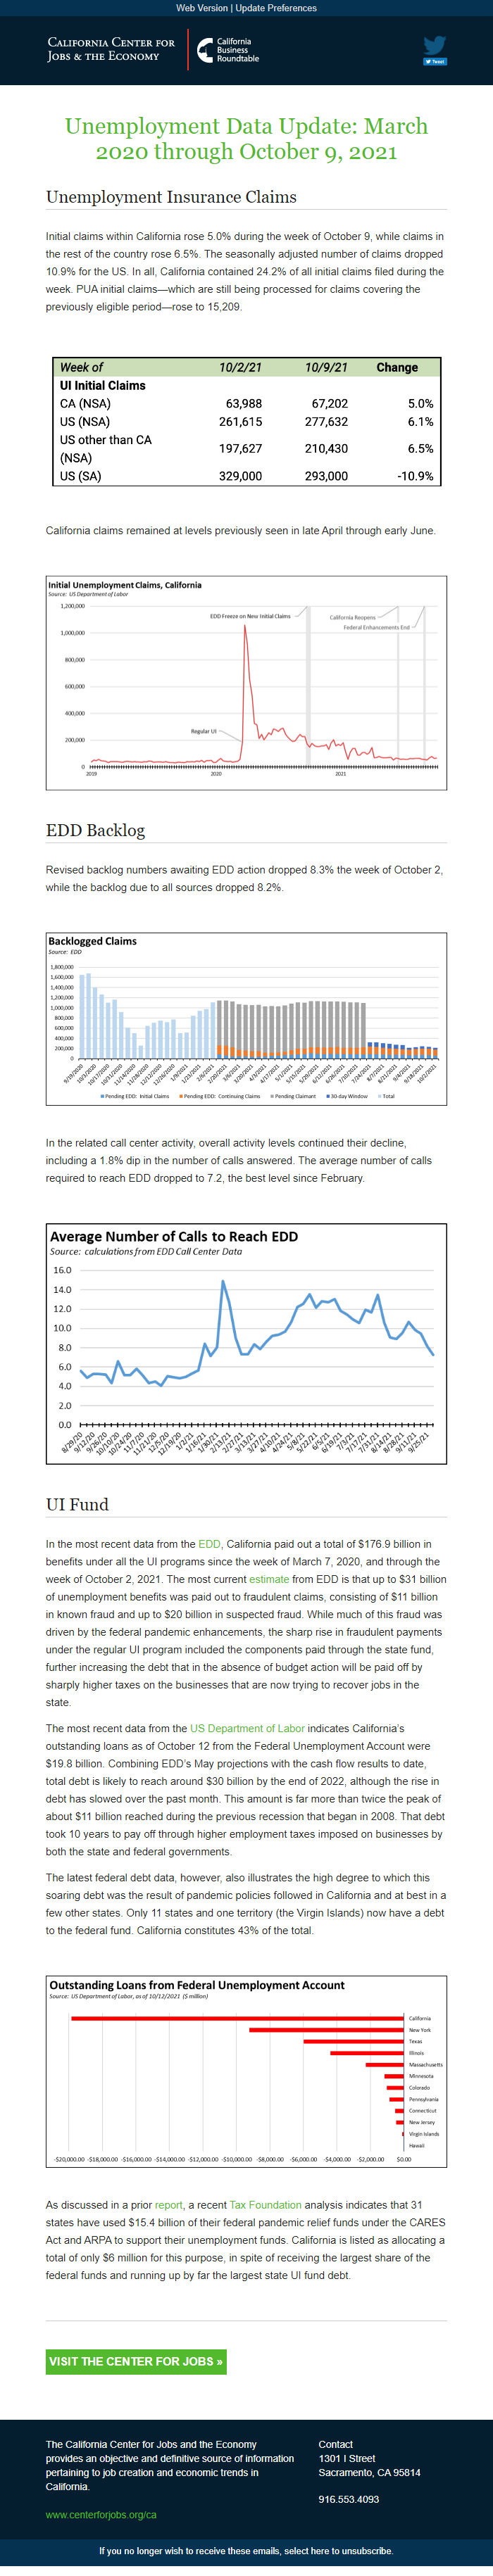
The most recent data from US Department of Labor [[link removed]]indicates California’s outstanding loans as of August 24 from the Federal Unemployment Account rose to $23.8 billion. Combining EDD’s May projections with the cash flow results to date, total debt is likely to reach around $30 billion by the end of 2022. This amount is far more than twice the peak of about $11 billion reached during the previous recession that began in 2008. That debt took 10 years to pay off through higher employment taxes imposed on businesses by both the state and federal governments.
With Maryland and West Virginia paying off their debts, the number of states with a federal fund debt now stands at only 13 (plus the Virgin Islands). California accounts for 44% of the total.
In the current debt circumstances, California employers are locked into paying the higher F+ state rates likely for more than another decade, while the federal tax increases are currently slated to start going into effect next year. These tax increases will more than outweigh the assistance recently included in the state budget, more than offsetting that effort to stimulate jobs restoration in the state.
In determining the amount each employer pays, two factors come into play: the tax rate and the wage base. California along with 4 other states and Puerto Rico maintain the federal wage base of the first $7,000 of wages. The 2020 median among the states and territories is $14,000, but the level ranges from the $7,000 federal base to $52,700 in Washington.
In a very simplistic if not misleading analysis, simply raising the California taxable wage base to match Washington’s would result in substantially increased revenues to the state fund. Multiplying the current California rate and the Washington base would result in about $2,100 instead of $281 using the California base. This calculation is misleading on two counts.
First, at this high wage base level, not all jobs would produce the full $2,100. In 2020, the median hourly wage [[link removed]] in Washington was $24.81. Using the average weekly hours [[link removed]] for private workers results in a median wage of about $45,000, meaning less than half of the jobs in Washington would yield the full $2,100.
More importantly, no state imposes unemployment taxes at this level, in no small part due to the significant disincentive it would have on job creation especially for lower and middle-skill workers. Rates instead also vary widely. Again using the 2020 data [[link removed]], California had by far the highest rate at 4.01% of taxable wages compared to the overall US average of 1.72%. The median—half of the states below and half above—was only 1.36%. Washington had one of the lowest at 0.87%. Measured instead as a percent of total wages rather than taxable wages, Washington’s effective tax rate of 0.47% was below California’s at 0.49%.
California’s tax rates are already at the highest under state law. The current conditions of the state fund are not because employers are paying too little; they are because state actions during the pandemic had the effect of expecting the fund to do too much.
visit the center for jobs » [[link removed]] The California Center for Jobs and the Economy provides an objective and definitive source of information pertaining to job creation and economic trends in California. [[link removed]] Contact 1301 I Street Sacramento, CA 95814 916.553.4093 If you no longer wish to receive these emails, select here to unsubscribe. [link removed]
Total initial claims fell in both California and the nation for the week of August 21.
Within the state, initial claims under the regular program were down 5.7% and dropped more broadly by 18.5% for PUA. Combined, total claims fell 11.5%, finally reversing the general rise that began in mid-July. The total, however, is still just over 50% higher than the previous low hit at the beginning of June.
Nationally, regular program claims dropped 3.7%, and PUA claims slightly slower at a 12.0% drop. Total claims were down 6.0%, bringing the total to yet another low since the PUA component began in March 2020.
Return to Work
As discussed in more detail in our Job Report [[link removed]] on the May results, most states have shifted policies in response to growing concerns that the unprecedented federal enhancements to unemployment insurance payments are a key factor in the worker shortages that threaten to hold back the speed and extent of the economic recovery while also contributing to inflationary pressures. These policy changes can be categorized within one of three groups:
Early Action States: After accounting for changes as the result of court orders in two states, 24 states halted some or all of the federal benefit enhancements prior to the September expirations, retaining the core state benefit structures as part of their ongoing safety net programs. These states generally also have reinstituted the previous job search requirements as well, while Arizona, Montana, New Hampshire, and Oklahoma have also included a “signing bonus” for those returning to a job. Oklahoma also provides up to 60 days of free child care for returning workers.
Job Search States: California and another 22 states resumed the previous job search requirements will be resumed in order for recipients to maintain benefits. Of these states, Colorado, Connecticut, and Virginia have also instituted “signing bonuses” for those returning to a job. California while technically in this category, has implemented job search requirements that are far broader [[link removed]?] than those in many other states.
No Change States: Only 4 states have not announced any related policies to accelerate the return to work.
These distinctions will largely disappear after September 4, when the federal pandemic unemployment benefit enhancements [[link removed]] mostly expire. EDD, however, has indicated that they will continue processing some claims filed covering the eligible periods.
Preliminary studies [[link removed]] of the effect of these different policies so far indicate there have been only modest differences in the rate of jobs growth between the different groups of states. The issue is not entirely clear yet for a number of reasons. First, these analyses are preliminary, taking into account only one month of data so far. Additional data will be coming in, but a number of factors are obviously in play affecting jobs results in each of the states. The precise contribution of the benefits change will be difficult to separate out as all states move beyond the September 4 deadline. Second, the analyses lump the states into only two categories, obfuscating the fact that several states instead chose to reinstate job search requirements rather than change benefit levels, introducing a policy change that substantially affects the conclusions. Third, the analyses focus on jobs, while other data indicates a strong shift—especially in other states where this option is not restricted as in California due to AB 5—to self-employment and to workers starting their own businesses. Workers still reluctant to return to a workplace setting (jobs) instead have pursued other earned income opportunities, and these numbers are reflected in the employment rather than the jobs data. Both Labor Force and Employment recovery in the recent July numbers were much further along in the Early Action states. This outcome also reflects the situation that actions on the enhanced benefits is in some respects more an indicator, as the Early Action states, in general, were already engaged in broader policy actions to get people back to work.
And fourth, regardless of the measure used, California remains well behind the other groupings. The latest week’s results finally show some improvement in the California numbers, but comparing to the week of June 12 when the Early Action state changes began going into effect still shows California initial claims rising 17.4% in this period and dropping 26.1% in the Early Action states.
While the policy response [[link removed]] from the state has been to encourage recipients to replace the expiring benefits with other public assistance programs, job openings have been rising sharply in the state as in the rest of the nation. Nationally, the latest nonfarm job openings (seasonally adjusted) in June reached 10.1 million, or a third higher than the previous peak seen in late 2018. This level was also 6% higher than the official number of unemployed workers available to fill them that month, although the skills mix in the unemployed pool does not necessarily fully conform with the requirements of the unfilled jobs.
Currently, comparable estimates from BLS for the states lag the US numbers by about 3 months but will be reported monthly beginning in October. In the meantime, other, more current data sources indicate that job openings are rising rapidly but lagging the US total by about 4-5 months—another indication of the state facing a slower recovery than the rest of the nation. As shown in the chart, Emsi [[link removed]] maintains a similar data series, but one that counts the number of job postings from various on-line sources within each month rather than unfilled job openings remaining at the end. While the national numbers have moved ahead, California job postings are now back to 2019 levels, a period when the state and nation were near full employment. In the July numbers, California had 1.391 million job postings, or just 3% lower than the number of official unemployed that month.
As discussed in our prior reports, the state actions during the pandemic had the most severe economic consequences on lower-wage jobs, and demographically saw job loss somewhat more among the young, women, and non-White workers. While the demographic information from the unemployment insurance claims data is incomplete, some additional information is available through the Current Population Survey results, although the small size of this survey generally makes annual rather than monthly or quarterly estimates more statistically valid on the state level.
Using quarterly estimates as an illustration, however, unemployment rates rose substantially across all demographics but showed a much larger increase for African-Americans compared to the same period in pre-pandemic 2019. Looking at just rates, though, can be misleading due to the interplay between the number of unemployed and the labor force base, including factors such as the shifting population mix and the accelerated retirement rate over the pandemic period among older, generally more White workers. Looking instead at the absolute numbers, the distribution across racial/ethnic groups similarly shows a higher shift in African-American unemployed and a relatively lesser effect among White unemployed, although about a third of the shift for White unemployed is the result of the underlying demographic changes in the labor force base. The other demographic groups similarly show a slight distribution shift as well, but these are generally consistent with the changes in the underlying labor force base. In all cases, however, the numbers cover only the officially unemployed—those out of work and looking for a job as generally defined by the state’s unemployment insurance job search requirements. They do not include those who have left the labor force, which in our current estimates cover about another 500,000 workers.
The distributional effects of the September 4 deadline, however, stem from the policy decisions made over the course of the pandemic. As reflected in the latest jobs numbers, California significantly lags the other states in both nonfarm jobs recovery (9th lowest) and employment recovery (8th lowest). Instead, California has relied to a greater extent on unemployment insurance as the de facto income support program for a far larger share of its workforce in this period. That program, however, was never designed for this role at this scale, and the repeated failures in terms of backlogs, applicant delays and frustration, and unparalleled fraud are only some of the indicators of this situation. The failure to date to address the $24 billion and rising debt is yet another indicator but is also one that will continue to affect the pace of jobs-oriented alternatives in the years ahead.
The effects stemming from the September 4 deadline are only part of the outcomes. While unemployment insurance provided benefits to deal with the immediate effects of the state’s pandemic strategies, there are longer-term effects to consider as well. As extensively documented, long-term unemployment is associated with lower lifetime wage, income, and employment opportunities. Other states have been far more aggressive in combating these risks by moving more quickly back to recovery levels.
Backlogs
Under their revised definition of the backlog, EDD now counts claims awaiting EDD action for more than 21 days plus claimants who are with the 30-day period to certify their eligibility for benefits. In the results for the week of August 28, the first component dropped 4.5%. The combined total was down 3.3%.
In the related call center data, overall activity continued to drop, but with the number of calls edging up 1.7% to 2.2 million and the number of answered calls dropping 2.9%. It still required an average of 9.5 calls to reach EDD.
UI Fund
In the most recent data from EDD [[link removed]], California paid out a total of $168.9 billion in benefits under all the UI programs since the week of March 7, 2020, and through the week of August 21, 2021. The most current estimate [[link removed]] from EDD is that up to $31 billion of unemployment benefits was paid out to fraudulent claims, consisting of $11 billion in known fraud and up to $20 billion in suspected fraud. Individual cases [[link removed]] continue to unfold [[link removed]]. Nationwide, current fraud total estimates range from $87 billion to $400 billion. [[link removed]]
The most recent data from US Department of Labor [[link removed]]indicates California’s outstanding loans as of August 24 from the Federal Unemployment Account rose to $23.8 billion. Combining EDD’s May projections with the cash flow results to date, total debt is likely to reach around $30 billion by the end of 2022. This amount is far more than twice the peak of about $11 billion reached during the previous recession that began in 2008. That debt took 10 years to pay off through higher employment taxes imposed on businesses by both the state and federal governments.
With Maryland and West Virginia paying off their debts, the number of states with a federal fund debt now stands at only 13 (plus the Virgin Islands). California accounts for 44% of the total.
In the current debt circumstances, California employers are locked into paying the higher F+ state rates likely for more than another decade, while the federal tax increases are currently slated to start going into effect next year. These tax increases will more than outweigh the assistance recently included in the state budget, more than offsetting that effort to stimulate jobs restoration in the state.
In determining the amount each employer pays, two factors come into play: the tax rate and the wage base. California along with 4 other states and Puerto Rico maintain the federal wage base of the first $7,000 of wages. The 2020 median among the states and territories is $14,000, but the level ranges from the $7,000 federal base to $52,700 in Washington.
In a very simplistic if not misleading analysis, simply raising the California taxable wage base to match Washington’s would result in substantially increased revenues to the state fund. Multiplying the current California rate and the Washington base would result in about $2,100 instead of $281 using the California base. This calculation is misleading on two counts.
First, at this high wage base level, not all jobs would produce the full $2,100. In 2020, the median hourly wage [[link removed]] in Washington was $24.81. Using the average weekly hours [[link removed]] for private workers results in a median wage of about $45,000, meaning less than half of the jobs in Washington would yield the full $2,100.
More importantly, no state imposes unemployment taxes at this level, in no small part due to the significant disincentive it would have on job creation especially for lower and middle-skill workers. Rates instead also vary widely. Again using the 2020 data [[link removed]], California had by far the highest rate at 4.01% of taxable wages compared to the overall US average of 1.72%. The median—half of the states below and half above—was only 1.36%. Washington had one of the lowest at 0.87%. Measured instead as a percent of total wages rather than taxable wages, Washington’s effective tax rate of 0.47% was below California’s at 0.49%.
California’s tax rates are already at the highest under state law. The current conditions of the state fund are not because employers are paying too little; they are because state actions during the pandemic had the effect of expecting the fund to do too much.
visit the center for jobs » [[link removed]] The California Center for Jobs and the Economy provides an objective and definitive source of information pertaining to job creation and economic trends in California. [[link removed]] Contact 1301 I Street Sacramento, CA 95814 916.553.4093 If you no longer wish to receive these emails, select here to unsubscribe. [link removed]
Message Analysis
- Sender: California Center for Jobs and the Economy
- Political Party: n/a
- Country: United States
- State/Locality: California
- Office: n/a
-
Email Providers:
- Campaign Monitor