| From | Center for Jobs and the Economy <[email protected]> |
| Subject | California Energy Price Data for September 2021 |
| Date | October 6, 2021 11:30 PM |
Links have been removed from this email. Learn more in the FAQ.
Links have been removed from this email. Learn more in the FAQ.
Web Version [link removed] | Update Preferences [link removed] [link removed] California Energy Price Data
for September 2021
Below are the monthly updates from the most current September 2021 fuel price data (GasBuddy.com) and July 2021 electricity and natural gas price data (US Energy Information Administration). To view additional data and analysis related to the California economy visit our website at [[link removed]].
The sustained escalation in both energy prices and average monthly costs reinforces a reminder that rising costs of living and rising costs of doing business in California currently remain a part of the state’s economic future. These increasingly unaffordable cost additions are not the result of the state’s climate change program; they are the outcome of the way the state has chosen to pursue it. While the nation’s greenhouse emission reductions have largely matched [[link removed]] those in California, and in some years dropped at a greater rate, the national reductions have been achieved at far lower costs, especially to lower and middle income households.
The data presented below as usual provides comparative energy cost information with a one to three month lag, and consequently does not yet incorporate recent activity likely leading to even higher costs:
Oil and natural gas prices rose sharply after OPEC rejected [[link removed]] President Biden’s request to increase production to offset drops in US production and exports. Through October 5, crude oil futures [[link removed]] rose 63% since the beginning of the year to just below $80 a barrel. Natural gas futures [[link removed]] rose 156%. These price rises will flow through the data tracked in these reports over the coming months as consumers and employers use energy directly especially for heating in the upcoming winter months. These higher costs will also move into the price of thousands of products that rely on these supplies as a feedstock or input at some point in the production and distribution chain. The current production restrictions are occurring just as demand is increasing due to the normal period of stockpiling in anticipation of winter demands and as overall demand is increasing in line with global economic recovery. At a minimum, these supply and cost pressures will fuel the rising inflation experienced in recent months. At worst, they will present yet another but far more substantial supply disruption affecting the future path of the recovery. This latter effect is already being seen elsewhere. In Europe [[link removed]], coal and natural gas shortages combined with drops in renewables output have produced power shortages, spiking energy prices, shifts to oil and more expensive LNG imports, and the threat of power company bankruptcies [[link removed]]. In China, climate change program limitations on coal production and energy efficiency goals again combined with drops in renewables output have also produced widespread power shortages [[link removed]], leading to a renewed wave of production shutdowns that are contributing to the supply chain blockages already affecting production and product availability in the US. Faced with these shortages, US companies have been forced to shut down [[link removed]] their own production, actions that will limit potential recovery job and income gains in the coming months, and in other instances allocated limited component supplies to higher price and higher margin products [[link removed]]in order to survive economically in this period, actions that will contribute further to rising inflation. The shortages in China are also affecting future costs for renewables in the state and the US as well. While California has generated some "clean energy" jobs under its climate policies, the bulk has been temporary jobs related to construction and installation activities. Manufacturing and production jobs related to materials and equipment instead are located elsewhere, with China containing about 70% of global solar panel capacity. Rising material and shipping costs are affecting the economics of an increasing number of wind projects [[link removed]]. Production shut-downs in China are creating shortfalls in many critical components [[link removed]] required to maintain solar panel supplies.
The economic consequences of the current energy supply disruptions are a reminder that a range of energy sources remain a part of our present and likely will be essential at least for our foreseeable future as well. Our monthly tracking will continue to report the costs to California’s households and businesses as the state’s approach to the issues continues to unfold.
Inflation Rising 4.5% Annual Change in
California CPI
July 2021
For the 12 months ending July, the California CPI rose 4.5%. In the same period, the US CPI rose 5.4%. In both instances, inflation is at its highest level since 2008.
California vs. US Fuel Price Gap at 42.2% Premium $1.31 Price Per Gallon
Above US Average
(CA Average)
The September average price per gallon of regular gasoline in California stayed level in August at $4.40, but still showed a 36.2% rise over the past year. The California premium above the average for the US other than California ($3.10) eased a penny to $1.31, a 42.2% difference.
1st Ranked By Price
In September, California again had the highest gasoline price among the states and DC. Californians paid $1.59 a gallon more than consumers in Mississippi, the state with the lowest price.
California vs. US Diesel Price $1.16 Price Per Gallon
Above US Average
(CA Average)
The September average price per gallon of diesel in California rose 2 cents from August to $4.40, a 31.1% increase over the year. The California premium above the average for the US other than California ($3.24) remained at $1.16, a 35.9% difference.
1st Ranked by Price
In September, California had the highest diesel price among the states and DC.
Range Between Highest and Lowest Prices by Region $1.40 Price per Gallon
Above US Average
(Central Sierra &
Central Coast Regions)
The cost premium above the US (other than California) average price for regular gasoline ranged from $1.24 in the Central Valley Region (average September price of $4.34), to $1.40 in Central Sierra and Central Coast Regions (average September price of $4.50).
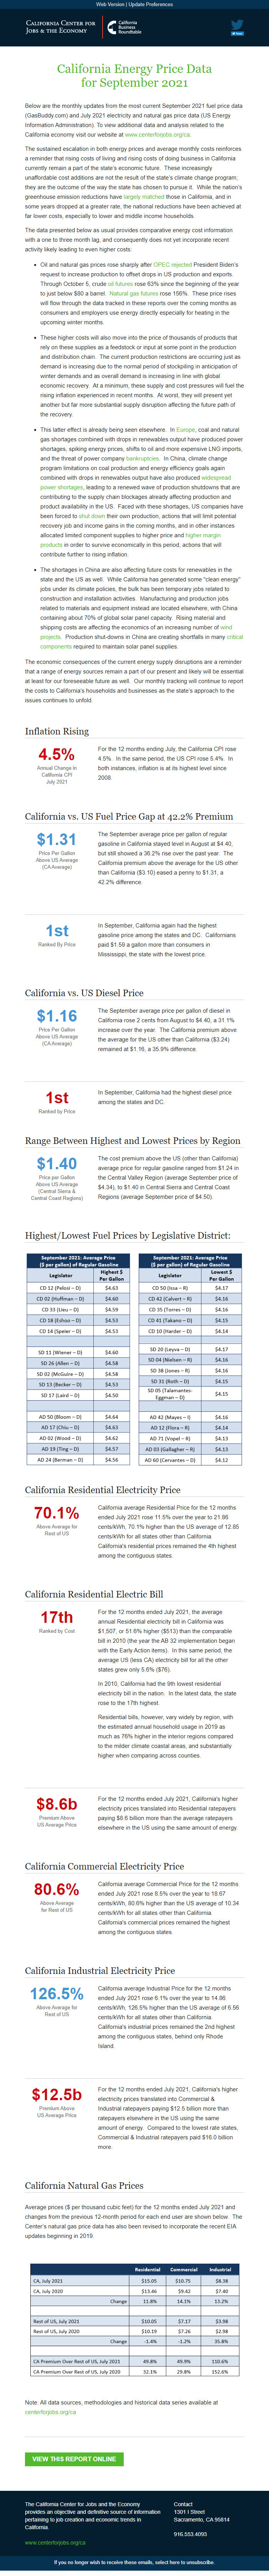
Highest/Lowest Fuel Prices by Legislative District: California Residential Electricity Price 70.1% Above Average for
Rest of US
California average Residential Price for the 12 months ended July 2021 rose 11.5% over the year to 21.86 cents/kWh, 70.1% higher than the US average of 12.85 cents/kWh for all states other than California. California's residential prices remained the 4th highest among the contiguous states.
California Residential Electric Bill 17th Ranked by Cost
For the 12 months ended July 2021, the average annual Residential electricity bill in California was $1,507, or 51.6% higher ($513) than the comparable bill in 2010 (the year the AB 32 implementation began with the Early Action items). In this same period, the average US (less CA) electricity bill for all the other states grew only 5.6% ($76).
In 2010, California had the 9th lowest residential electricity bill in the nation. In the latest data, the state rose to the 17th highest.
Residential bills, however, vary widely by region, with the estimated annual household usage in 2019 as much as 76% higher in the interior regions compared to the milder climate coastal areas, and substantially higher when comparing across counties.
$8.6b Premium Above
US Average Price
For the 12 months ended July 2021, California's higher electricity prices translated into Residential ratepayers paying $8.6 billion more than the average ratepayers elsewhere in the US using the same amount of energy.
California Commercial Electricity Price 80.6% Above Average
for Rest of US
California average Commercial Price for the 12 months ended July 2021 rose 8.5% over the year to 18.67 cents/kWh, 80.6% higher than the US average of 10.34 cents/kWh for all states other than California. California's commercial prices remained the highest among the contiguous states.
California Industrial Electricity Price 126.5% Above Average for
Rest of US
California average Industrial Price for the 12 months ended July 2021 rose 6.1% over the year to 14.86 cents/kWh, 126.5% higher than the US average of 6.56 cents/kWh for all states other than California. California's industrial prices remained the 2nd highest among the contiguous states, behind only Rhode Island.
$12.5b Premium Above
US Average Price
For the 12 months ended July 2021, California's higher electricity prices translated into Commercial & Industrial ratepayers paying $12.5 billion more than ratepayers elsewhere in the US using the same amount of energy. Compared to the lowest rate states, Commercial & Industrial ratepayers paid $16.0 billion more.
California Natural Gas Prices
Average prices ($ per thousand cubic feet) for the 12 months ended July 2021 and changes from the previous 12-month period for each end user are shown below. The Center’s natural gas price data has also been revised to incorporate the recent EIA updates beginning in 2019.
Note: All data sources, methodologies and historical data series available at [[link removed]]
View this Report Online [[link removed]] The California Center for Jobs and the Economy provides an objective and definitive source of information pertaining to job creation and economic trends in California. [[link removed]] Contact 1301 I Street Sacramento, CA 95814 916.553.4093 If you no longer wish to receive these emails, select here to unsubscribe. [link removed]
for September 2021
Below are the monthly updates from the most current September 2021 fuel price data (GasBuddy.com) and July 2021 electricity and natural gas price data (US Energy Information Administration). To view additional data and analysis related to the California economy visit our website at [[link removed]].
The sustained escalation in both energy prices and average monthly costs reinforces a reminder that rising costs of living and rising costs of doing business in California currently remain a part of the state’s economic future. These increasingly unaffordable cost additions are not the result of the state’s climate change program; they are the outcome of the way the state has chosen to pursue it. While the nation’s greenhouse emission reductions have largely matched [[link removed]] those in California, and in some years dropped at a greater rate, the national reductions have been achieved at far lower costs, especially to lower and middle income households.
The data presented below as usual provides comparative energy cost information with a one to three month lag, and consequently does not yet incorporate recent activity likely leading to even higher costs:
Oil and natural gas prices rose sharply after OPEC rejected [[link removed]] President Biden’s request to increase production to offset drops in US production and exports. Through October 5, crude oil futures [[link removed]] rose 63% since the beginning of the year to just below $80 a barrel. Natural gas futures [[link removed]] rose 156%. These price rises will flow through the data tracked in these reports over the coming months as consumers and employers use energy directly especially for heating in the upcoming winter months. These higher costs will also move into the price of thousands of products that rely on these supplies as a feedstock or input at some point in the production and distribution chain. The current production restrictions are occurring just as demand is increasing due to the normal period of stockpiling in anticipation of winter demands and as overall demand is increasing in line with global economic recovery. At a minimum, these supply and cost pressures will fuel the rising inflation experienced in recent months. At worst, they will present yet another but far more substantial supply disruption affecting the future path of the recovery. This latter effect is already being seen elsewhere. In Europe [[link removed]], coal and natural gas shortages combined with drops in renewables output have produced power shortages, spiking energy prices, shifts to oil and more expensive LNG imports, and the threat of power company bankruptcies [[link removed]]. In China, climate change program limitations on coal production and energy efficiency goals again combined with drops in renewables output have also produced widespread power shortages [[link removed]], leading to a renewed wave of production shutdowns that are contributing to the supply chain blockages already affecting production and product availability in the US. Faced with these shortages, US companies have been forced to shut down [[link removed]] their own production, actions that will limit potential recovery job and income gains in the coming months, and in other instances allocated limited component supplies to higher price and higher margin products [[link removed]]in order to survive economically in this period, actions that will contribute further to rising inflation. The shortages in China are also affecting future costs for renewables in the state and the US as well. While California has generated some "clean energy" jobs under its climate policies, the bulk has been temporary jobs related to construction and installation activities. Manufacturing and production jobs related to materials and equipment instead are located elsewhere, with China containing about 70% of global solar panel capacity. Rising material and shipping costs are affecting the economics of an increasing number of wind projects [[link removed]]. Production shut-downs in China are creating shortfalls in many critical components [[link removed]] required to maintain solar panel supplies.
The economic consequences of the current energy supply disruptions are a reminder that a range of energy sources remain a part of our present and likely will be essential at least for our foreseeable future as well. Our monthly tracking will continue to report the costs to California’s households and businesses as the state’s approach to the issues continues to unfold.
Inflation Rising 4.5% Annual Change in
California CPI
July 2021
For the 12 months ending July, the California CPI rose 4.5%. In the same period, the US CPI rose 5.4%. In both instances, inflation is at its highest level since 2008.
California vs. US Fuel Price Gap at 42.2% Premium $1.31 Price Per Gallon
Above US Average
(CA Average)
The September average price per gallon of regular gasoline in California stayed level in August at $4.40, but still showed a 36.2% rise over the past year. The California premium above the average for the US other than California ($3.10) eased a penny to $1.31, a 42.2% difference.
1st Ranked By Price
In September, California again had the highest gasoline price among the states and DC. Californians paid $1.59 a gallon more than consumers in Mississippi, the state with the lowest price.
California vs. US Diesel Price $1.16 Price Per Gallon
Above US Average
(CA Average)
The September average price per gallon of diesel in California rose 2 cents from August to $4.40, a 31.1% increase over the year. The California premium above the average for the US other than California ($3.24) remained at $1.16, a 35.9% difference.
1st Ranked by Price
In September, California had the highest diesel price among the states and DC.
Range Between Highest and Lowest Prices by Region $1.40 Price per Gallon
Above US Average
(Central Sierra &
Central Coast Regions)
The cost premium above the US (other than California) average price for regular gasoline ranged from $1.24 in the Central Valley Region (average September price of $4.34), to $1.40 in Central Sierra and Central Coast Regions (average September price of $4.50).
Highest/Lowest Fuel Prices by Legislative District: California Residential Electricity Price 70.1% Above Average for
Rest of US
California average Residential Price for the 12 months ended July 2021 rose 11.5% over the year to 21.86 cents/kWh, 70.1% higher than the US average of 12.85 cents/kWh for all states other than California. California's residential prices remained the 4th highest among the contiguous states.
California Residential Electric Bill 17th Ranked by Cost
For the 12 months ended July 2021, the average annual Residential electricity bill in California was $1,507, or 51.6% higher ($513) than the comparable bill in 2010 (the year the AB 32 implementation began with the Early Action items). In this same period, the average US (less CA) electricity bill for all the other states grew only 5.6% ($76).
In 2010, California had the 9th lowest residential electricity bill in the nation. In the latest data, the state rose to the 17th highest.
Residential bills, however, vary widely by region, with the estimated annual household usage in 2019 as much as 76% higher in the interior regions compared to the milder climate coastal areas, and substantially higher when comparing across counties.
$8.6b Premium Above
US Average Price
For the 12 months ended July 2021, California's higher electricity prices translated into Residential ratepayers paying $8.6 billion more than the average ratepayers elsewhere in the US using the same amount of energy.
California Commercial Electricity Price 80.6% Above Average
for Rest of US
California average Commercial Price for the 12 months ended July 2021 rose 8.5% over the year to 18.67 cents/kWh, 80.6% higher than the US average of 10.34 cents/kWh for all states other than California. California's commercial prices remained the highest among the contiguous states.
California Industrial Electricity Price 126.5% Above Average for
Rest of US
California average Industrial Price for the 12 months ended July 2021 rose 6.1% over the year to 14.86 cents/kWh, 126.5% higher than the US average of 6.56 cents/kWh for all states other than California. California's industrial prices remained the 2nd highest among the contiguous states, behind only Rhode Island.
$12.5b Premium Above
US Average Price
For the 12 months ended July 2021, California's higher electricity prices translated into Commercial & Industrial ratepayers paying $12.5 billion more than ratepayers elsewhere in the US using the same amount of energy. Compared to the lowest rate states, Commercial & Industrial ratepayers paid $16.0 billion more.
California Natural Gas Prices
Average prices ($ per thousand cubic feet) for the 12 months ended July 2021 and changes from the previous 12-month period for each end user are shown below. The Center’s natural gas price data has also been revised to incorporate the recent EIA updates beginning in 2019.
Note: All data sources, methodologies and historical data series available at [[link removed]]
View this Report Online [[link removed]] The California Center for Jobs and the Economy provides an objective and definitive source of information pertaining to job creation and economic trends in California. [[link removed]] Contact 1301 I Street Sacramento, CA 95814 916.553.4093 If you no longer wish to receive these emails, select here to unsubscribe. [link removed]
Message Analysis
- Sender: California Center for Jobs and the Economy
- Political Party: n/a
- Country: United States
- State/Locality: California
- Office: n/a
-
Email Providers:
- Campaign Monitor