Email
Market Pullback?
| From | Irving Wilkinson <[email protected]> |
| Subject | Market Pullback? |
| Date | September 10, 2021 3:57 PM |
Links have been removed from this email. Learn more in the FAQ.
Links have been removed from this email. Learn more in the FAQ.
Market Pullback?
Good afternoon,
The market is definitely setting up for a pullback, but how much and
when is the key question. The market is at a key tipping point.
Right now, I am going over the data this morning and working on next
week's _ADVISOR MARKET INTELLIGENCE REPORT_.
Many of the market indicators look like 2008. Back then, I was
running the inside sales desk for a broker-dealer. It was very scary,
but this is worse for several reasons.
Last night's announcement by Biden of a national vaccine mandate went
over like a fart in church.
This comes after the horrible pullout of Afghanistan. His poll numbers
are sinking fast.
Why does this matter?
3 Words: DEBT CEILING LIMIT
Next week Congress will most likely start talking about raising the
national debt ceiling limit. Most Republicans have publicly stated
they won't increase it.
Biden and Democrats may be too weak to pass the debt ceiling and
spending bills.
What this means is that neither the Federal Reserve nor the Treasury
will most likely have the resources to keep pumping the economy.
So we could have a "shutdown" that could accelerate a market pullback
that would likely not have many "brake" options by the Fed.
I will be covering this more in Monday's report. Please consider
trying it _for $19.95 per month_
[[link removed]] _or __save more money by paying
annually $99.95. (click here for annual)
[[link removed]]__._
MARKET NOTES 9-10-21
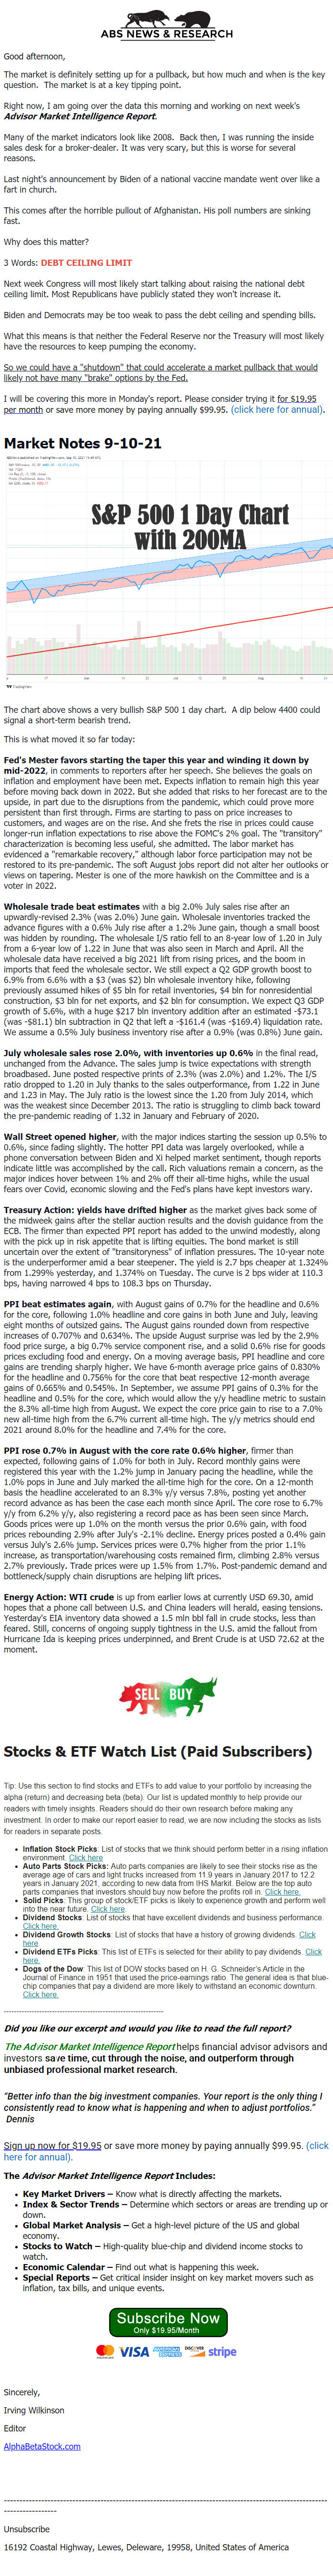
The chart above shows a very bullish S&P 500 1 day chart. A dip
below 4400 could signal a short-term bearish trend.
This is what moved it so far today:
FED'S MESTER FAVORS STARTING THE TAPER THIS YEAR AND WINDING IT DOWN
BY MID-2022, in comments to reporters after her speech. She believes
the goals on inflation and employment have been met. Expects inflation
to remain high this year before moving back down in 2022. But she
added that risks to her forecast are to the upside, in part due to the
disruptions from the pandemic, which could prove more persistent than
first through. Firms are starting to pass on price increases to
customers, and wages are on the rise. And she frets the rise in prices
could cause longer-run inflation expectations to rise above the FOMC's
2% goal. The "transitory" characterization is becoming less useful,
she admitted. The labor market has evidenced a "remarkable recovery,"
although labor force participation may not be restored to its
pre-pandemic. The soft August jobs report did not alter her outlooks
or views on tapering. Mester is one of the more hawkish on the
Committee and is a voter in 2022.
WHOLESALE TRADE BEAT ESTIMATES with a big 2.0% July sales rise after
an upwardly-revised 2.3% (was 2.0%) June gain. Wholesale inventories
tracked the advance figures with a 0.6% July rise after a 1.2% June
gain, though a small boost was hidden by rounding. The wholesale I/S
ratio fell to an 8-year low of 1.20 in July from a 6-year low of 1.22
in June that was also seen in March and April. All the wholesale data
have received a big 2021 lift from rising prices, and the boom in
imports that feed the wholesale sector. We still expect a Q2 GDP
growth boost to 6.9% from 6.6% with a $3 (was $2) bln wholesale
inventory hike, following previously assumed hikes of $5 bln for
retail inventories, $4 bln for nonresidential construction, $3 bln for
net exports, and $2 bln for consumption. We expect Q3 GDP growth of
5.6%, with a huge $217 bln inventory addition after an estimated
-$73.1 (was -$81.1) bln subtraction in Q2 that left a -$161.4 (was
-$169.4) liquidation rate. We assume a 0.5% July business inventory
rise after a 0.9% (was 0.8%) June gain.
JULY WHOLESALE SALES ROSE 2.0%, WITH INVENTORIES UP 0.6% in the final
read, unchanged from the Advance. The sales jump is twice expectations
with strength broadbased. June posted respective prints of 2.3% (was
2.0%) and 1.2%. The I/S ratio dropped to 1.20 in July thanks to the
sales outperformance, from 1.22 in June and 1.23 in May. The July
ratio is the lowest since the 1.20 from July 2014, which was the
weakest since December 2013. The ratio is struggling to climb back
toward the pre-pandemic reading of 1.32 in January and February of
2020.
WALL STREET OPENED HIGHER, with the major indices starting the session
up 0.5% to 0.6%, since fading slightly. The hotter PPI data was
largely overlooked, while a phone conversation between Biden and Xi
helped market sentiment, though reports indicate little was
accomplished by the call. Rich valuations remain a concern, as the
major indices hover between 1% and 2% off their all-time highs, while
the usual fears over Covid, economic slowing and the Fed's plans have
kept investors wary.
TREASURY ACTION: YIELDS HAVE DRIFTED HIGHER as the market gives back
some of the midweek gains after the stellar auction results and the
dovish guidance from the ECB. The firmer than expected PPI report has
added to the unwind modestly, along with the pick up in risk appetite
that is lifting equities. The bond market is still uncertain over the
extent of "transitoryness" of inflation pressures. The 10-year note is
the underperformer amid a bear steepener. The yield is 2.7 bps cheaper
at 1.324% from 1.299% yesterday, and 1.374% on Tuesday. The curve is 2
bps wider at 110.3 bps, having narrowed 4 bps to 108.3 bps on
Thursday.
PPI BEAT ESTIMATES AGAIN, with August gains of 0.7% for the headline
and 0.6% for the core, following 1.0% headline and core gains in both
June and July, leaving eight months of outsized gains. The August
gains rounded down from respective increases of 0.707% and 0.634%. The
upside August surprise was led by the 2.9% food price surge, a big
0.7% service component rise, and a solid 0.6% rise for goods prices
excluding food and energy. On a moving average basis, PPI headline and
core gains are trending sharply higher. We have 6-month average price
gains of 0.830% for the headline and 0.756% for the core that beat
respective 12-month average gains of 0.665% and 0.545%. In September,
we assume PPI gains of 0.3% for the headline and 0.5% for the core,
which would allow the y/y headline metric to sustain the 8.3% all-time
high from August. We expect the core price gain to rise to a 7.0% new
all-time high from the 6.7% current all-time high. The y/y metrics
should end 2021 around 8.0% for the headline and 7.4% for the core.
PPI ROSE 0.7% IN AUGUST WITH THE CORE RATE 0.6% HIGHER, firmer than
expected, following gains of 1.0% for both in July. Record monthly
gains were registered this year with the 1.2% jump in January pacing
the headline, while the 1.0% pops in June and July marked the all-time
high for the core. On a 12-month basis the headline accelerated to an
8.3% y/y versus 7.8%, posting yet another record advance as has been
the case each month since April. The core rose to 6.7% y/y from 6.2%
y/y, also registering a record pace as has been seen since March.
Goods prices were up 1.0% on the month versus the prior 0.6% gain,
with food prices rebounding 2.9% after July's -2.1% decline. Energy
prices posted a 0.4% gain versus July's 2.6% jump. Services prices
were 0.7% higher from the prior 1.1% increase, as
transportation/warehousing costs remained firm, climbing 2.8% versus
2.7% previously. Trade prices were up 1.5% from 1.7%. Post-pandemic
demand and bottleneck/supply chain disruptions are helping lift
prices.
ENERGY ACTION: WTI CRUDE is up from earlier lows at currently USD
69.30, amid hopes that a phone call between U.S. and China leaders
will herald, easing tensions. Yesterday's EIA inventory data showed a
1.5 mln bbl fall in crude stocks, less than feared. Still, concerns of
ongoing supply tightness in the U.S. amid the fallout from Hurricane
Ida is keeping prices underpinned, and Brent Crude is at USD 72.62 at
the moment.
STOCKS & ETF WATCH LIST (PAID SUBSCRIBERS)
Tip: Use this section to find stocks and ETFs to add value to your
portfolio by increasing the alpha (return) and decreasing beta (beta).
Our list is updated monthly to help provide our readers with timely
insights. Readers should do their own research before making any
investment. In order to make our report easier to read, we are now
including the stocks as lists for readers in separate posts.
* INFLATION STOCK PICKS: List of stocks that we think should perform
better in a rising inflation environment. Click here
[[link removed]]
* AUTO PARTS STOCK PICKS: Auto parts companies are likely to see
their stocks rise as the average age of cars and light trucks
increased from 11.9 years in January 2017 to 12.2 years in January
2021, according to new data from IHS Markit. Below are the top auto
parts companies that investors should buy now before the profits roll
in. Click here.
[[link removed]]
* SOLID PICKS: This group of stock/ETF picks is likely to experience
growth and perform well into the near future. Click here
[[link removed]].
* DIVIDEND STOCKS: List of stocks that have excellent dividends and
business performance. Click here.
[[link removed]]
* DIVIDEND GROWTH STOCKS: List of stocks that have a history of
growing dividends. Click here
[[link removed]].
* DIVIDEND ETFS PICKS: This list of ETFs is selected for their
ability to pay dividends. Click here.
[[link removed]]
* DOGS OF THE DOW: This list of DOW stocks based on H. G.
Schneider’s Article in the Journal of Finance in 1951 that used the
price-earnings ratio. The general idea is that blue-chip companies
that pay a dividend are more likely to withstand an economic downturn.
Click here. [[link removed]]
---------------------------------------------------------------
_DID YOU LIKE OUR EXCERPT AND WOULD YOU LIKE TO READ THE FULL
REPORT?__ _
_THE ADVISOR MARKET INTELLIGENCE REPORT_ helps financial advisor
advisors and investors SAVE TIME, CUT THROUGH THE NOISE, AND
OUTPERFORM THROUGH UNBIASED PROFESSIONAL MARKET RESEARCH.
_“Better info than the big investment companies. Your report is the
only thing I consistently read to know what is happening and when to
adjust portfolios.” Dennis_
_Sign up now for $19.95_ [[link removed]]_ or __save
more money by paying annually $99.95. (click here for annual)
[[link removed]].
_
THE _ADVISOR MARKET INTELLIGENCE REPORT _INCLUDES:
* KEY MARKET DRIVERS – Know what is directly affecting the
markets.
* INDEX & SECTOR TRENDS – Determine which sectors or areas are
trending up or down.
* GLOBAL MARKET ANALYSIS – Get a high-level picture of the US and
global economy.
* STOCKS TO WATCH – High-quality blue-chip and dividend income
stocks to watch.
* ECONOMIC CALENDAR – Find out what is happening this week.
* SPECIAL REPORTS – Get critical insider insight on key market
movers such as inflation, tax bills, and unique events.
[[link removed]]
Sincerely,
Irving Wilkinson
Editor
AlphaBetaStock.com [[link removed]]
-------------------------------------------------------------------------------------------------------------------------
Unsubscribe
[[link removed]]
16192 Coastal Highway, Lewes, Deleware, 19958, United States of
America
Good afternoon,
The market is definitely setting up for a pullback, but how much and
when is the key question. The market is at a key tipping point.
Right now, I am going over the data this morning and working on next
week's _ADVISOR MARKET INTELLIGENCE REPORT_.
Many of the market indicators look like 2008. Back then, I was
running the inside sales desk for a broker-dealer. It was very scary,
but this is worse for several reasons.
Last night's announcement by Biden of a national vaccine mandate went
over like a fart in church.
This comes after the horrible pullout of Afghanistan. His poll numbers
are sinking fast.
Why does this matter?
3 Words: DEBT CEILING LIMIT
Next week Congress will most likely start talking about raising the
national debt ceiling limit. Most Republicans have publicly stated
they won't increase it.
Biden and Democrats may be too weak to pass the debt ceiling and
spending bills.
What this means is that neither the Federal Reserve nor the Treasury
will most likely have the resources to keep pumping the economy.
So we could have a "shutdown" that could accelerate a market pullback
that would likely not have many "brake" options by the Fed.
I will be covering this more in Monday's report. Please consider
trying it _for $19.95 per month_
[[link removed]] _or __save more money by paying
annually $99.95. (click here for annual)
[[link removed]]__._
MARKET NOTES 9-10-21
The chart above shows a very bullish S&P 500 1 day chart. A dip
below 4400 could signal a short-term bearish trend.
This is what moved it so far today:
FED'S MESTER FAVORS STARTING THE TAPER THIS YEAR AND WINDING IT DOWN
BY MID-2022, in comments to reporters after her speech. She believes
the goals on inflation and employment have been met. Expects inflation
to remain high this year before moving back down in 2022. But she
added that risks to her forecast are to the upside, in part due to the
disruptions from the pandemic, which could prove more persistent than
first through. Firms are starting to pass on price increases to
customers, and wages are on the rise. And she frets the rise in prices
could cause longer-run inflation expectations to rise above the FOMC's
2% goal. The "transitory" characterization is becoming less useful,
she admitted. The labor market has evidenced a "remarkable recovery,"
although labor force participation may not be restored to its
pre-pandemic. The soft August jobs report did not alter her outlooks
or views on tapering. Mester is one of the more hawkish on the
Committee and is a voter in 2022.
WHOLESALE TRADE BEAT ESTIMATES with a big 2.0% July sales rise after
an upwardly-revised 2.3% (was 2.0%) June gain. Wholesale inventories
tracked the advance figures with a 0.6% July rise after a 1.2% June
gain, though a small boost was hidden by rounding. The wholesale I/S
ratio fell to an 8-year low of 1.20 in July from a 6-year low of 1.22
in June that was also seen in March and April. All the wholesale data
have received a big 2021 lift from rising prices, and the boom in
imports that feed the wholesale sector. We still expect a Q2 GDP
growth boost to 6.9% from 6.6% with a $3 (was $2) bln wholesale
inventory hike, following previously assumed hikes of $5 bln for
retail inventories, $4 bln for nonresidential construction, $3 bln for
net exports, and $2 bln for consumption. We expect Q3 GDP growth of
5.6%, with a huge $217 bln inventory addition after an estimated
-$73.1 (was -$81.1) bln subtraction in Q2 that left a -$161.4 (was
-$169.4) liquidation rate. We assume a 0.5% July business inventory
rise after a 0.9% (was 0.8%) June gain.
JULY WHOLESALE SALES ROSE 2.0%, WITH INVENTORIES UP 0.6% in the final
read, unchanged from the Advance. The sales jump is twice expectations
with strength broadbased. June posted respective prints of 2.3% (was
2.0%) and 1.2%. The I/S ratio dropped to 1.20 in July thanks to the
sales outperformance, from 1.22 in June and 1.23 in May. The July
ratio is the lowest since the 1.20 from July 2014, which was the
weakest since December 2013. The ratio is struggling to climb back
toward the pre-pandemic reading of 1.32 in January and February of
2020.
WALL STREET OPENED HIGHER, with the major indices starting the session
up 0.5% to 0.6%, since fading slightly. The hotter PPI data was
largely overlooked, while a phone conversation between Biden and Xi
helped market sentiment, though reports indicate little was
accomplished by the call. Rich valuations remain a concern, as the
major indices hover between 1% and 2% off their all-time highs, while
the usual fears over Covid, economic slowing and the Fed's plans have
kept investors wary.
TREASURY ACTION: YIELDS HAVE DRIFTED HIGHER as the market gives back
some of the midweek gains after the stellar auction results and the
dovish guidance from the ECB. The firmer than expected PPI report has
added to the unwind modestly, along with the pick up in risk appetite
that is lifting equities. The bond market is still uncertain over the
extent of "transitoryness" of inflation pressures. The 10-year note is
the underperformer amid a bear steepener. The yield is 2.7 bps cheaper
at 1.324% from 1.299% yesterday, and 1.374% on Tuesday. The curve is 2
bps wider at 110.3 bps, having narrowed 4 bps to 108.3 bps on
Thursday.
PPI BEAT ESTIMATES AGAIN, with August gains of 0.7% for the headline
and 0.6% for the core, following 1.0% headline and core gains in both
June and July, leaving eight months of outsized gains. The August
gains rounded down from respective increases of 0.707% and 0.634%. The
upside August surprise was led by the 2.9% food price surge, a big
0.7% service component rise, and a solid 0.6% rise for goods prices
excluding food and energy. On a moving average basis, PPI headline and
core gains are trending sharply higher. We have 6-month average price
gains of 0.830% for the headline and 0.756% for the core that beat
respective 12-month average gains of 0.665% and 0.545%. In September,
we assume PPI gains of 0.3% for the headline and 0.5% for the core,
which would allow the y/y headline metric to sustain the 8.3% all-time
high from August. We expect the core price gain to rise to a 7.0% new
all-time high from the 6.7% current all-time high. The y/y metrics
should end 2021 around 8.0% for the headline and 7.4% for the core.
PPI ROSE 0.7% IN AUGUST WITH THE CORE RATE 0.6% HIGHER, firmer than
expected, following gains of 1.0% for both in July. Record monthly
gains were registered this year with the 1.2% jump in January pacing
the headline, while the 1.0% pops in June and July marked the all-time
high for the core. On a 12-month basis the headline accelerated to an
8.3% y/y versus 7.8%, posting yet another record advance as has been
the case each month since April. The core rose to 6.7% y/y from 6.2%
y/y, also registering a record pace as has been seen since March.
Goods prices were up 1.0% on the month versus the prior 0.6% gain,
with food prices rebounding 2.9% after July's -2.1% decline. Energy
prices posted a 0.4% gain versus July's 2.6% jump. Services prices
were 0.7% higher from the prior 1.1% increase, as
transportation/warehousing costs remained firm, climbing 2.8% versus
2.7% previously. Trade prices were up 1.5% from 1.7%. Post-pandemic
demand and bottleneck/supply chain disruptions are helping lift
prices.
ENERGY ACTION: WTI CRUDE is up from earlier lows at currently USD
69.30, amid hopes that a phone call between U.S. and China leaders
will herald, easing tensions. Yesterday's EIA inventory data showed a
1.5 mln bbl fall in crude stocks, less than feared. Still, concerns of
ongoing supply tightness in the U.S. amid the fallout from Hurricane
Ida is keeping prices underpinned, and Brent Crude is at USD 72.62 at
the moment.
STOCKS & ETF WATCH LIST (PAID SUBSCRIBERS)
Tip: Use this section to find stocks and ETFs to add value to your
portfolio by increasing the alpha (return) and decreasing beta (beta).
Our list is updated monthly to help provide our readers with timely
insights. Readers should do their own research before making any
investment. In order to make our report easier to read, we are now
including the stocks as lists for readers in separate posts.
* INFLATION STOCK PICKS: List of stocks that we think should perform
better in a rising inflation environment. Click here
[[link removed]]
* AUTO PARTS STOCK PICKS: Auto parts companies are likely to see
their stocks rise as the average age of cars and light trucks
increased from 11.9 years in January 2017 to 12.2 years in January
2021, according to new data from IHS Markit. Below are the top auto
parts companies that investors should buy now before the profits roll
in. Click here.
[[link removed]]
* SOLID PICKS: This group of stock/ETF picks is likely to experience
growth and perform well into the near future. Click here
[[link removed]].
* DIVIDEND STOCKS: List of stocks that have excellent dividends and
business performance. Click here.
[[link removed]]
* DIVIDEND GROWTH STOCKS: List of stocks that have a history of
growing dividends. Click here
[[link removed]].
* DIVIDEND ETFS PICKS: This list of ETFs is selected for their
ability to pay dividends. Click here.
[[link removed]]
* DOGS OF THE DOW: This list of DOW stocks based on H. G.
Schneider’s Article in the Journal of Finance in 1951 that used the
price-earnings ratio. The general idea is that blue-chip companies
that pay a dividend are more likely to withstand an economic downturn.
Click here. [[link removed]]
---------------------------------------------------------------
_DID YOU LIKE OUR EXCERPT AND WOULD YOU LIKE TO READ THE FULL
REPORT?__ _
_THE ADVISOR MARKET INTELLIGENCE REPORT_ helps financial advisor
advisors and investors SAVE TIME, CUT THROUGH THE NOISE, AND
OUTPERFORM THROUGH UNBIASED PROFESSIONAL MARKET RESEARCH.
_“Better info than the big investment companies. Your report is the
only thing I consistently read to know what is happening and when to
adjust portfolios.” Dennis_
_Sign up now for $19.95_ [[link removed]]_ or __save
more money by paying annually $99.95. (click here for annual)
[[link removed]].
_
THE _ADVISOR MARKET INTELLIGENCE REPORT _INCLUDES:
* KEY MARKET DRIVERS – Know what is directly affecting the
markets.
* INDEX & SECTOR TRENDS – Determine which sectors or areas are
trending up or down.
* GLOBAL MARKET ANALYSIS – Get a high-level picture of the US and
global economy.
* STOCKS TO WATCH – High-quality blue-chip and dividend income
stocks to watch.
* ECONOMIC CALENDAR – Find out what is happening this week.
* SPECIAL REPORTS – Get critical insider insight on key market
movers such as inflation, tax bills, and unique events.
[[link removed]]
Sincerely,
Irving Wilkinson
Editor
AlphaBetaStock.com [[link removed]]
-------------------------------------------------------------------------------------------------------------------------
Unsubscribe
[[link removed]]
16192 Coastal Highway, Lewes, Deleware, 19958, United States of
America
Message Analysis
- Sender: n/a
- Political Party: n/a
- Country: n/a
- State/Locality: n/a
- Office: n/a