| From | Center for Jobs and the Economy <[email protected]> |
| Subject | California Trade Report for June 2021 |
| Date | August 6, 2021 6:30 PM |
Links have been removed from this email. Learn more in the FAQ.
Links have been removed from this email. Learn more in the FAQ.
Web Version [link removed] | Update Preferences [link removed] [link removed] California Trade Report
for June 2021
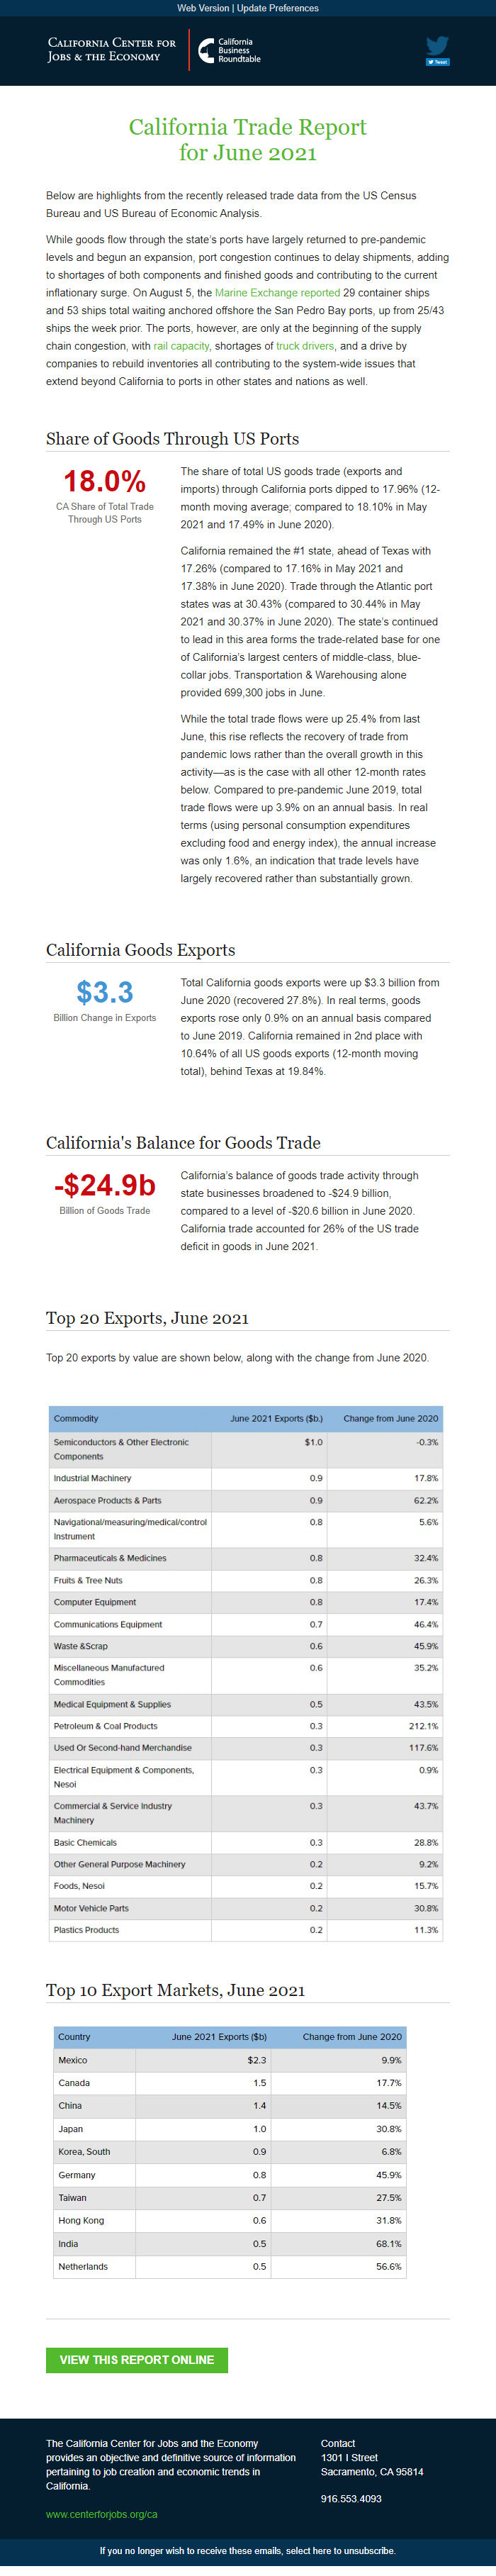
Below are highlights from the recently released trade data from the US Census Bureau and US Bureau of Economic Analysis.
While goods flow through the state’s ports have largely returned to pre-pandemic levels and begun an expansion, port congestion continues to delay shipments, adding to shortages of both components and finished goods and contributing to the current inflationary surge. On August 5, the Marine Exchange reported [[link removed]] 29 container ships and 53 ships total waiting anchored offshore the San Pedro Bay ports, up from 25/43 ships the week prior. The ports, however, are only at the beginning of the supply chain congestion, with rail capacity [[link removed]], shortages of truck drivers [[link removed]], and a drive by companies to rebuild inventories all contributing to the system-wide issues that extend beyond California to ports in other states and nations as well.
Share of Goods Through US Ports 18.0% CA Share of Total Trade
Through US Ports
The share of total US goods trade (exports and imports) through California ports dipped to 17.96% (12-month moving average; compared to 18.10% in May 2021 and 17.49% in June 2020).
California remained the #1 state, ahead of Texas with 17.26% (compared to 17.16% in May 2021 and 17.38% in June 2020). Trade through the Atlantic port states was at 30.43% (compared to 30.44% in May 2021 and 30.37% in June 2020). The state’s continued to lead in this area forms the trade-related base for one of California’s largest centers of middle-class, blue-collar jobs. Transportation & Warehousing alone provided 699,300 jobs in June.
While the total trade flows were up 25.4% from last June, this rise reflects the recovery of trade from pandemic lows rather than the overall growth in this activity—as is the case with all other 12-month rates below. Compared to pre-pandemic June 2019, total trade flows were up 3.9% on an annual basis. In real terms (using personal consumption expenditures excluding food and energy index), the annual increase was only 1.6%, an indication that trade levels have largely recovered rather than substantially grown.
California Goods Exports $3.3 Billion Change in Exports
Total California goods exports were up $3.3 billion from June 2020 (recovered 27.8%). In real terms, goods exports rose only 0.9% on an annual basis compared to June 2019. California remained in 2nd place with 10.64% of all US goods exports (12-month moving total), behind Texas at 19.84%.
California's Balance for Goods Trade -$24.9b Billion of Goods Trade
California’s balance of goods trade activity through state businesses broadened to -$24.9 billion, compared to a level of -$20.6 billion in June 2020. California trade accounted for 26% of the US trade deficit in goods in June 2021.
Top 20 Exports, June 2021
Top 20 exports by value are shown below, along with the change from June 2020.
Top 10 Export Markets, June 2021 View This Report Online [[link removed]] The California Center for Jobs and the Economy provides an objective and definitive source of information pertaining to job creation and economic trends in California. [[link removed]] Contact 1301 I Street Sacramento, CA 95814 916.553.4093 If you no longer wish to receive these emails, select here to unsubscribe. [link removed]
for June 2021
Below are highlights from the recently released trade data from the US Census Bureau and US Bureau of Economic Analysis.
While goods flow through the state’s ports have largely returned to pre-pandemic levels and begun an expansion, port congestion continues to delay shipments, adding to shortages of both components and finished goods and contributing to the current inflationary surge. On August 5, the Marine Exchange reported [[link removed]] 29 container ships and 53 ships total waiting anchored offshore the San Pedro Bay ports, up from 25/43 ships the week prior. The ports, however, are only at the beginning of the supply chain congestion, with rail capacity [[link removed]], shortages of truck drivers [[link removed]], and a drive by companies to rebuild inventories all contributing to the system-wide issues that extend beyond California to ports in other states and nations as well.
Share of Goods Through US Ports 18.0% CA Share of Total Trade
Through US Ports
The share of total US goods trade (exports and imports) through California ports dipped to 17.96% (12-month moving average; compared to 18.10% in May 2021 and 17.49% in June 2020).
California remained the #1 state, ahead of Texas with 17.26% (compared to 17.16% in May 2021 and 17.38% in June 2020). Trade through the Atlantic port states was at 30.43% (compared to 30.44% in May 2021 and 30.37% in June 2020). The state’s continued to lead in this area forms the trade-related base for one of California’s largest centers of middle-class, blue-collar jobs. Transportation & Warehousing alone provided 699,300 jobs in June.
While the total trade flows were up 25.4% from last June, this rise reflects the recovery of trade from pandemic lows rather than the overall growth in this activity—as is the case with all other 12-month rates below. Compared to pre-pandemic June 2019, total trade flows were up 3.9% on an annual basis. In real terms (using personal consumption expenditures excluding food and energy index), the annual increase was only 1.6%, an indication that trade levels have largely recovered rather than substantially grown.
California Goods Exports $3.3 Billion Change in Exports
Total California goods exports were up $3.3 billion from June 2020 (recovered 27.8%). In real terms, goods exports rose only 0.9% on an annual basis compared to June 2019. California remained in 2nd place with 10.64% of all US goods exports (12-month moving total), behind Texas at 19.84%.
California's Balance for Goods Trade -$24.9b Billion of Goods Trade
California’s balance of goods trade activity through state businesses broadened to -$24.9 billion, compared to a level of -$20.6 billion in June 2020. California trade accounted for 26% of the US trade deficit in goods in June 2021.
Top 20 Exports, June 2021
Top 20 exports by value are shown below, along with the change from June 2020.
Top 10 Export Markets, June 2021 View This Report Online [[link removed]] The California Center for Jobs and the Economy provides an objective and definitive source of information pertaining to job creation and economic trends in California. [[link removed]] Contact 1301 I Street Sacramento, CA 95814 916.553.4093 If you no longer wish to receive these emails, select here to unsubscribe. [link removed]
Message Analysis
- Sender: California Center for Jobs and the Economy
- Political Party: n/a
- Country: United States
- State/Locality: California
- Office: n/a
-
Email Providers:
- Campaign Monitor