Email
Unemployment Data Update: March 2020 through July 24, 2021
| From | Center for Jobs and the Economy <[email protected]> |
| Subject | Unemployment Data Update: March 2020 through July 24, 2021 |
| Date | July 30, 2021 4:00 PM |
Links have been removed from this email. Learn more in the FAQ.
Links have been removed from this email. Learn more in the FAQ.
Web Version [link removed] | Update Preferences [link removed] [link removed] Unemployment Data Update: March 2020 through July 24, 2021 Unemployment Insurance Claims
Total initial claims rose sharply in California the week of July 24 while dropping more substantially elsewhere in the US. The US total fell to a new low for the pandemic period, while the California total was at its highest level since early April.
In California, initial claims processed in the regular program rose 19.4% compared to the prior week, while PUA claims edged down by 2.2%. In the national totals, regular claims dropped 16.2%, while PUA claims fell 13.4%. Combined, total claims processed in California climbed 10.3% while dropping 15.6% in the US numbers.
Enhanced Unemployment & Recovery
As discussed in more detail in our Job Report [[link removed]] on the May results, most states have shifted policies in response to growing concerns that the unprecedented federal enhancements to unemployment insurance payments are a key factor in the worker shortages that threaten to hold back the speed and extent of the economic recovery while also contributing to inflationary pressures. These policy changes can be categorized within one of three groups:
Early Action States: Previously, 26 states had announced an early end to some or all of the federal benefit enhancements prior to the September expirations, retaining the core state benefit structures as part of their ongoing safety net programs. Lawsuits [[link removed]] against these actions have been filed in at least six states, with judges issuing injunctions on at least a portion of these actions in Indiana and Maryland, leaving 24 states in this category. These states generally also have reinstituted the previous job search requirements as well, while Arizona, Montana, New Hampshire, and Oklahoma have also included a “signing bonus” for those returning to a job. Oklahoma also provides up to 60 days of free child care for returning workers.
Job Search States: California and another 22 states (including now Indiana and Maryland) have announced that the previous job search requirements will be resumed in order for recipients to maintain benefits. Of these states, Colorado, Connecticut, and Virginia have also instituted “signing bonuses” for those returning to a job. California, while technically in this category, has implemented job search requirements that are far broader than those in many other states and that includes a range of qualifying activities short of actually applying for jobs.
No Change States: Only four states have not announced any related policies to accelerate the return to work.
Taking the week of June 12—when the first changes under the Early Action states went into effect—as the comparison base, the now 24 Early Action states combined have seen a 22.5% drop in the number of initial claims. California in this period saw a 23.3% increase in spite of eliminating the previous county tier restrictions on June 15. The other Job Search states—where these provisions largely were already in effect—saw a 17.4% drop. Putting aside Illinois, the No Change states saw a 0.4% rise. Illinois, the other No Change state, saw the deepest cuts overall at 51.1%, but this number stems from changes to combat widespread fraud [[link removed]] in its system rather than the other policy options underway elsewhere.
While much of the debate over benefit levels has focused on the disincentives to employment, the full implications to workers go beyond questions of immediate income effects. As demonstrated through the previous Great Recession that began in 2008, long-term unemployment has significant implications to long-term wage, income, and employability potential for the affected workers.
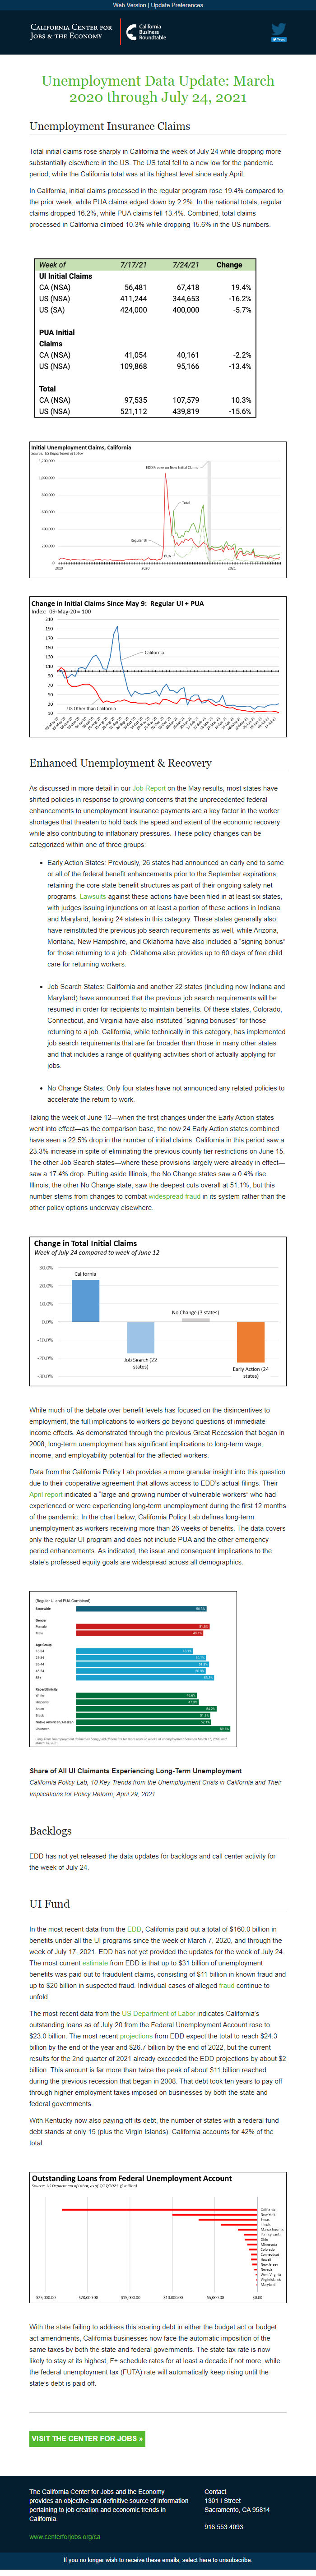
Data from the California Policy Lab provides a more granular insight into this question due to their cooperative agreement that allows access to EDD’s actual filings. Their April report [[link removed]] indicated a “large and growing number of vulnerable workers” who had experienced or were experiencing long-term unemployment during the first 12 months of the pandemic. In the chart below, California Policy Lab defines long-term unemployment as workers receiving more than 26 weeks of benefits. The data covers only the regular UI program and does not include PUA and the other emergency period enhancements. As indicated, the issue and consequent implications to the state’s professed equity goals are widespread across all demographics.
Share of All UI Claimants Experiencing Long-Term Unemployment
California Policy Lab, 10 Key Trends from the Unemployment Crisis in California and Their Implications for Policy Reform, April 29, 2021
Backlogs
EDD has not yet released the data updates for backlogs and call center activity for the week of July 24.
UI Fund
In the most recent data from the EDD [[link removed]], California paid out a total of $160.0 billion in benefits under all the UI programs since the week of March 7, 2020, and through the week of July 17, 2021. EDD has not yet provided the updates for the week of July 24. The most current estimate [[link removed]] from EDD is that up to $31 billion of unemployment benefits was paid out to fraudulent claims, consisting of $11 billion in known fraud and up to $20 billion in suspected fraud. Individual cases of alleged fraud [[link removed]] continue to unfold.
The most recent data from the US Department of Labor [[link removed]] indicates California’s outstanding loans as of July 20 from the Federal Unemployment Account rose to $23.0 billion. The most recent projections [[link removed]] from EDD expect the total to reach $24.3 billion by the end of the year and $26.7 billion by the end of 2022, but the current results for the 2nd quarter of 2021 already exceeded the EDD projections by about $2 billion. This amount is far more than twice the peak of about $11 billion reached during the previous recession that began in 2008. That debt took ten years to pay off through higher employment taxes imposed on businesses by both the state and federal governments.
With Kentucky now also paying off its debt, the number of states with a federal fund debt stands at only 15 (plus the Virgin Islands). California accounts for 42% of the total.
With the state failing to address this soaring debt in either the budget act or budget act amendments, California businesses now face the automatic imposition of the same taxes by both the state and federal governments. The state tax rate is now likely to stay at its highest, F+ schedule rates for at least a decade if not more, while the federal unemployment tax (FUTA) rate will automatically keep rising until the state’s debt is paid off.
visit the center for jobs » [[link removed]] The California Center for Jobs and the Economy provides an objective and definitive source of information pertaining to job creation and economic trends in California. [[link removed]] Contact 1301 I Street Sacramento, CA 95814 916.553.4093 If you no longer wish to receive these emails, select here to unsubscribe. [link removed]
Total initial claims rose sharply in California the week of July 24 while dropping more substantially elsewhere in the US. The US total fell to a new low for the pandemic period, while the California total was at its highest level since early April.
In California, initial claims processed in the regular program rose 19.4% compared to the prior week, while PUA claims edged down by 2.2%. In the national totals, regular claims dropped 16.2%, while PUA claims fell 13.4%. Combined, total claims processed in California climbed 10.3% while dropping 15.6% in the US numbers.
Enhanced Unemployment & Recovery
As discussed in more detail in our Job Report [[link removed]] on the May results, most states have shifted policies in response to growing concerns that the unprecedented federal enhancements to unemployment insurance payments are a key factor in the worker shortages that threaten to hold back the speed and extent of the economic recovery while also contributing to inflationary pressures. These policy changes can be categorized within one of three groups:
Early Action States: Previously, 26 states had announced an early end to some or all of the federal benefit enhancements prior to the September expirations, retaining the core state benefit structures as part of their ongoing safety net programs. Lawsuits [[link removed]] against these actions have been filed in at least six states, with judges issuing injunctions on at least a portion of these actions in Indiana and Maryland, leaving 24 states in this category. These states generally also have reinstituted the previous job search requirements as well, while Arizona, Montana, New Hampshire, and Oklahoma have also included a “signing bonus” for those returning to a job. Oklahoma also provides up to 60 days of free child care for returning workers.
Job Search States: California and another 22 states (including now Indiana and Maryland) have announced that the previous job search requirements will be resumed in order for recipients to maintain benefits. Of these states, Colorado, Connecticut, and Virginia have also instituted “signing bonuses” for those returning to a job. California, while technically in this category, has implemented job search requirements that are far broader than those in many other states and that includes a range of qualifying activities short of actually applying for jobs.
No Change States: Only four states have not announced any related policies to accelerate the return to work.
Taking the week of June 12—when the first changes under the Early Action states went into effect—as the comparison base, the now 24 Early Action states combined have seen a 22.5% drop in the number of initial claims. California in this period saw a 23.3% increase in spite of eliminating the previous county tier restrictions on June 15. The other Job Search states—where these provisions largely were already in effect—saw a 17.4% drop. Putting aside Illinois, the No Change states saw a 0.4% rise. Illinois, the other No Change state, saw the deepest cuts overall at 51.1%, but this number stems from changes to combat widespread fraud [[link removed]] in its system rather than the other policy options underway elsewhere.
While much of the debate over benefit levels has focused on the disincentives to employment, the full implications to workers go beyond questions of immediate income effects. As demonstrated through the previous Great Recession that began in 2008, long-term unemployment has significant implications to long-term wage, income, and employability potential for the affected workers.
Data from the California Policy Lab provides a more granular insight into this question due to their cooperative agreement that allows access to EDD’s actual filings. Their April report [[link removed]] indicated a “large and growing number of vulnerable workers” who had experienced or were experiencing long-term unemployment during the first 12 months of the pandemic. In the chart below, California Policy Lab defines long-term unemployment as workers receiving more than 26 weeks of benefits. The data covers only the regular UI program and does not include PUA and the other emergency period enhancements. As indicated, the issue and consequent implications to the state’s professed equity goals are widespread across all demographics.
Share of All UI Claimants Experiencing Long-Term Unemployment
California Policy Lab, 10 Key Trends from the Unemployment Crisis in California and Their Implications for Policy Reform, April 29, 2021
Backlogs
EDD has not yet released the data updates for backlogs and call center activity for the week of July 24.
UI Fund
In the most recent data from the EDD [[link removed]], California paid out a total of $160.0 billion in benefits under all the UI programs since the week of March 7, 2020, and through the week of July 17, 2021. EDD has not yet provided the updates for the week of July 24. The most current estimate [[link removed]] from EDD is that up to $31 billion of unemployment benefits was paid out to fraudulent claims, consisting of $11 billion in known fraud and up to $20 billion in suspected fraud. Individual cases of alleged fraud [[link removed]] continue to unfold.
The most recent data from the US Department of Labor [[link removed]] indicates California’s outstanding loans as of July 20 from the Federal Unemployment Account rose to $23.0 billion. The most recent projections [[link removed]] from EDD expect the total to reach $24.3 billion by the end of the year and $26.7 billion by the end of 2022, but the current results for the 2nd quarter of 2021 already exceeded the EDD projections by about $2 billion. This amount is far more than twice the peak of about $11 billion reached during the previous recession that began in 2008. That debt took ten years to pay off through higher employment taxes imposed on businesses by both the state and federal governments.
With Kentucky now also paying off its debt, the number of states with a federal fund debt stands at only 15 (plus the Virgin Islands). California accounts for 42% of the total.
With the state failing to address this soaring debt in either the budget act or budget act amendments, California businesses now face the automatic imposition of the same taxes by both the state and federal governments. The state tax rate is now likely to stay at its highest, F+ schedule rates for at least a decade if not more, while the federal unemployment tax (FUTA) rate will automatically keep rising until the state’s debt is paid off.
visit the center for jobs » [[link removed]] The California Center for Jobs and the Economy provides an objective and definitive source of information pertaining to job creation and economic trends in California. [[link removed]] Contact 1301 I Street Sacramento, CA 95814 916.553.4093 If you no longer wish to receive these emails, select here to unsubscribe. [link removed]
Message Analysis
- Sender: California Center for Jobs and the Economy
- Political Party: n/a
- Country: United States
- State/Locality: California
- Office: n/a
-
Email Providers:
- Campaign Monitor