Email
Unemployment Data Update: March 2020 through April 17, 2021
| From | Center for Jobs and the Economy <[email protected]> |
| Subject | Unemployment Data Update: March 2020 through April 17, 2021 |
| Date | April 22, 2021 9:00 PM |
Links have been removed from this email. Learn more in the FAQ.
Links have been removed from this email. Learn more in the FAQ.
Web Version [link removed] | Update Preferences [link removed] [link removed] Unemployment Data Update: March 2020 through April 17, 2021 Unemployment Insurance Claims
Total initial claims were largely level in California the week of April 17, while showing a significant drop in the rest of the US.
In California, initial claims processed in the regular program rose 4.3% compared to the prior week, while PUA claims dropped 13.9%. In the national totals, regular claims were down 9.4%, while PUA claims edged up 1.2%. Combined, total claims processed were off only 0.1% in California and fell 7.5% in the US numbers.
By industry, the largest number of initial claims (all programs) were filed by workers in Accommodation & Food Service (20.9%), Retail Trade (11.8%), and Health Care & Social Assistance (9.5%). These numbers indicate that the Tier adjustments of recent weeks have yet to reach the jobs hardest hit by the state restrictions during the pandemic period.
While the California numbers experienced a one-week pause, new claims here and in the rest of the states have been on a general downward trend since January. Both the California and US totals are new lows since claims began spiking in late March 2020.
County Tier Status & the Unemployed
In the most recent results for March, California tied with Connecticut and New Mexico for the third highest unemployment rate in the country, behind only Hawaii which is even more dependent on tourism-related employment and New York which adopted lock-down strategies comparable to California.
These numbers only cover the officially unemployed and not workers who have left the labor force during the pandemic period including workers who have given up on trying to find a job, workers who are fearful of contracting the disease if they get a job, and parents who have had to quit their jobs to take care of their children while California public schools have remained closed and while substantial uncertainty remains in many districts over when and how they will reopen.
The most recent tier allocations for the week of April 20 from the Department of Public Health [[link removed]] show continuing improvements in relieving restrictions to business activities and jobs. Counties in the second-lowest Tier 3 restrictions held 88.5% of March’s unemployment, but 11.4% remain within the second-highest Tier 2. All counties remain under some level of restrictions which present barriers to the state’s economic recovery and continued reliance of many workers on unemployment benefits, although the governor recently announced his intention [[link removed]] to remove the tiered system by June 15 but with some as yet unspecified virus-related provisions.
Vaccine Tracker
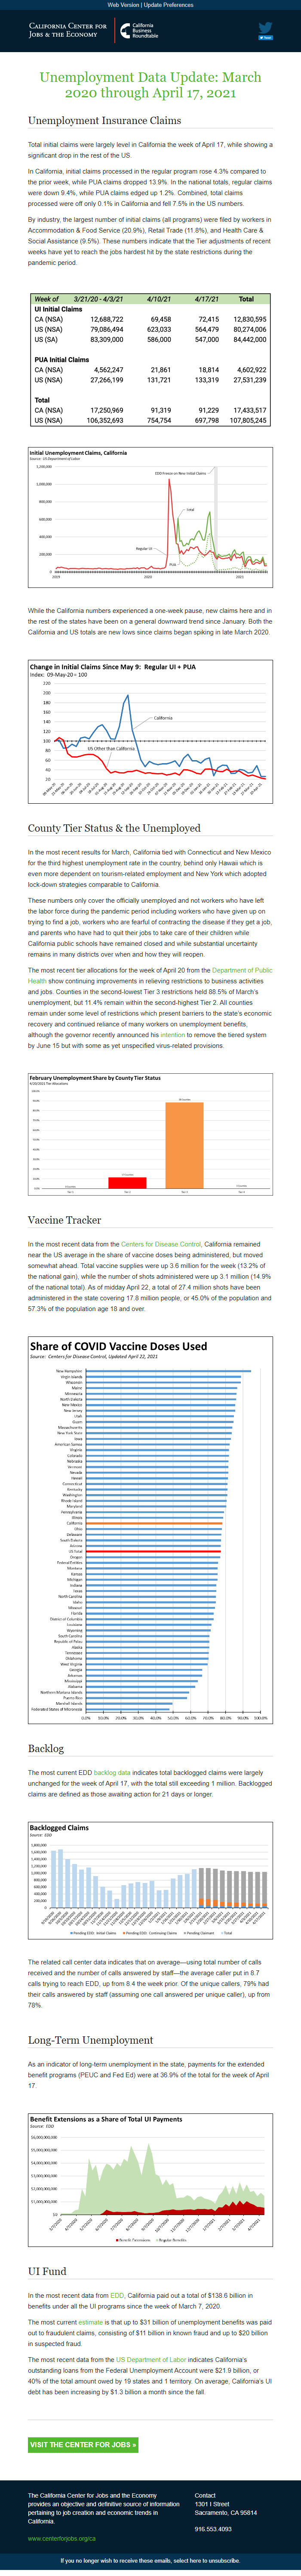
In the most recent data from the Centers for Disease Control [[link removed]], California remained near the US average in the share of vaccine doses being administered, but moved somewhat ahead. Total vaccine supplies were up 3.6 million for the week (13.2% of the national gain), while the number of shots administered were up 3.1 million (14.9% of the national total). As of midday April 22, a total of 27.4 million shots have been administered in the state covering 17.8 million people, or 45.0% of the population and 57.3% of the population age 18 and over.
Backlog
The most current EDD backlog data [[link removed]] indicates total backlogged claims were largely unchanged for the week of April 17, with the total still exceeding 1 million. Backlogged claims are defined as those awaiting action for 21 days or longer.
The related call center data indicates that on average—using total number of calls received and the number of calls answered by staff—the average caller put in 8.7 calls trying to reach EDD, up from 8.4 the week prior. Of the unique callers, 79% had their calls answered by staff (assuming one call answered per unique caller), up from 78%.
Long-Term Unemployment
As an indicator of long-term unemployment in the state, payments for the extended benefit programs (PEUC and Fed Ed) were at 36.9% of the total for the week of April 17.
UI Fund
In the most recent data from EDD [[link removed]], California paid out a total of $138.6 billion in benefits under all the UI programs since the week of March 7, 2020.
The most current estimate [[link removed]] is that up to $31 billion of unemployment benefits was paid out to fraudulent claims, consisting of $11 billion in known fraud and up to $20 billion in suspected fraud.
The most recent data from the US Department of Labor [[link removed]] indicates California’s outstanding loans from the Federal Unemployment Account were $21.9 billion, or 40% of the total amount owed by 19 states and 1 territory. On average, California’s UI debt has been increasing by $1.3 billion a month since the fall.
visit the center for jobs » [[link removed]] The California Center for Jobs and the Economy provides an objective and definitive source of information pertaining to job creation and economic trends in California. [[link removed]] Contact 1301 I Street Sacramento, CA 95814 916.553.4093 If you no longer wish to receive these emails, select here to unsubscribe. [link removed]
Total initial claims were largely level in California the week of April 17, while showing a significant drop in the rest of the US.
In California, initial claims processed in the regular program rose 4.3% compared to the prior week, while PUA claims dropped 13.9%. In the national totals, regular claims were down 9.4%, while PUA claims edged up 1.2%. Combined, total claims processed were off only 0.1% in California and fell 7.5% in the US numbers.
By industry, the largest number of initial claims (all programs) were filed by workers in Accommodation & Food Service (20.9%), Retail Trade (11.8%), and Health Care & Social Assistance (9.5%). These numbers indicate that the Tier adjustments of recent weeks have yet to reach the jobs hardest hit by the state restrictions during the pandemic period.
While the California numbers experienced a one-week pause, new claims here and in the rest of the states have been on a general downward trend since January. Both the California and US totals are new lows since claims began spiking in late March 2020.
County Tier Status & the Unemployed
In the most recent results for March, California tied with Connecticut and New Mexico for the third highest unemployment rate in the country, behind only Hawaii which is even more dependent on tourism-related employment and New York which adopted lock-down strategies comparable to California.
These numbers only cover the officially unemployed and not workers who have left the labor force during the pandemic period including workers who have given up on trying to find a job, workers who are fearful of contracting the disease if they get a job, and parents who have had to quit their jobs to take care of their children while California public schools have remained closed and while substantial uncertainty remains in many districts over when and how they will reopen.
The most recent tier allocations for the week of April 20 from the Department of Public Health [[link removed]] show continuing improvements in relieving restrictions to business activities and jobs. Counties in the second-lowest Tier 3 restrictions held 88.5% of March’s unemployment, but 11.4% remain within the second-highest Tier 2. All counties remain under some level of restrictions which present barriers to the state’s economic recovery and continued reliance of many workers on unemployment benefits, although the governor recently announced his intention [[link removed]] to remove the tiered system by June 15 but with some as yet unspecified virus-related provisions.
Vaccine Tracker
In the most recent data from the Centers for Disease Control [[link removed]], California remained near the US average in the share of vaccine doses being administered, but moved somewhat ahead. Total vaccine supplies were up 3.6 million for the week (13.2% of the national gain), while the number of shots administered were up 3.1 million (14.9% of the national total). As of midday April 22, a total of 27.4 million shots have been administered in the state covering 17.8 million people, or 45.0% of the population and 57.3% of the population age 18 and over.
Backlog
The most current EDD backlog data [[link removed]] indicates total backlogged claims were largely unchanged for the week of April 17, with the total still exceeding 1 million. Backlogged claims are defined as those awaiting action for 21 days or longer.
The related call center data indicates that on average—using total number of calls received and the number of calls answered by staff—the average caller put in 8.7 calls trying to reach EDD, up from 8.4 the week prior. Of the unique callers, 79% had their calls answered by staff (assuming one call answered per unique caller), up from 78%.
Long-Term Unemployment
As an indicator of long-term unemployment in the state, payments for the extended benefit programs (PEUC and Fed Ed) were at 36.9% of the total for the week of April 17.
UI Fund
In the most recent data from EDD [[link removed]], California paid out a total of $138.6 billion in benefits under all the UI programs since the week of March 7, 2020.
The most current estimate [[link removed]] is that up to $31 billion of unemployment benefits was paid out to fraudulent claims, consisting of $11 billion in known fraud and up to $20 billion in suspected fraud.
The most recent data from the US Department of Labor [[link removed]] indicates California’s outstanding loans from the Federal Unemployment Account were $21.9 billion, or 40% of the total amount owed by 19 states and 1 territory. On average, California’s UI debt has been increasing by $1.3 billion a month since the fall.
visit the center for jobs » [[link removed]] The California Center for Jobs and the Economy provides an objective and definitive source of information pertaining to job creation and economic trends in California. [[link removed]] Contact 1301 I Street Sacramento, CA 95814 916.553.4093 If you no longer wish to receive these emails, select here to unsubscribe. [link removed]
Message Analysis
- Sender: California Center for Jobs and the Economy
- Political Party: n/a
- Country: United States
- State/Locality: California
- Office: n/a
-
Email Providers:
- Campaign Monitor