| From | VPAP <[email protected]> |
| Subject | Visual: "Regional Winners/Losers in Redistricting" |
| Date | January 11, 2021 8:59 PM |
Links have been removed from this email. Learn more in the FAQ.
Links have been removed from this email. Learn more in the FAQ.
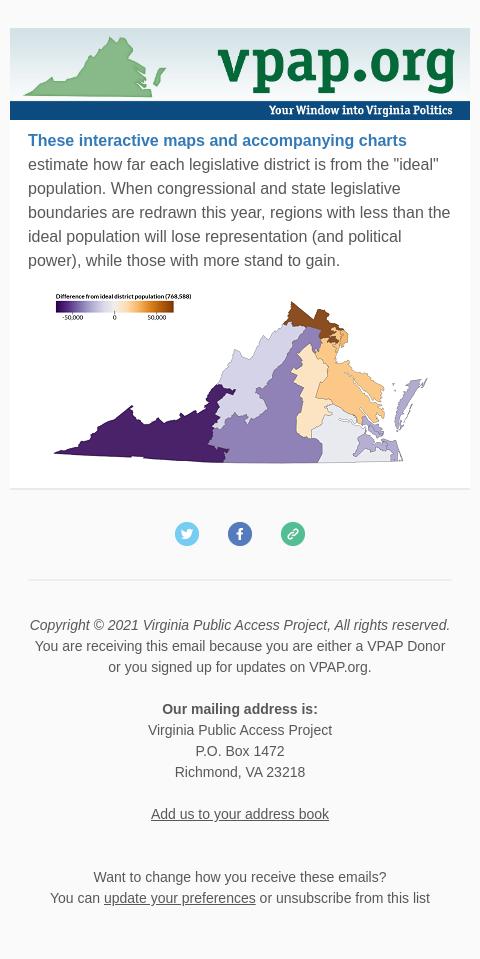
These interactive maps and accompanying charts ([link removed]) estimate how far each legislative district is from the "ideal" population. When congressional and state legislative boundaries are redrawn this year, regions with less than the ideal population will lose representation (and political power), while those with more stand to gain.
[link removed]
============================================================
** ([link removed])
** ([link removed])
** ([link removed])
Copyright © 2021 Virginia Public Access Project, All rights reserved.
You are receiving this email because you are either a VPAP Donor or you signed up for updates on VPAP.org.
Our mailing address is:
Virginia Public Access Project
P.O. Box 1472
Richmond, VA 23218
USA
Want to change how you receive these emails?
You can ** update your preferences ([link removed])
or ** unsubscribe from this list ([link removed])
Message Analysis
- Sender: Virginia Public Access Project (VPAP)
- Political Party: n/a
- Country: United States
- State/Locality: Virginia
- Office: n/a
-
Email Providers:
- MailChimp