Email
Unemployment Data Update: March through October 15, 2020
| From | Center for Jobs and the Economy <[email protected]> |
| Subject | Unemployment Data Update: March through October 15, 2020 |
| Date | October 15, 2020 10:30 PM |
Links have been removed from this email. Learn more in the FAQ.
Links have been removed from this email. Learn more in the FAQ.
Web Version [link removed] | Update Preferences [link removed] [link removed] Unemployment Data Update: March through October 15, 2020 Unemployment Insurance Claims
With EDD recently reopening to process new claims, no new unemployment insurance filing data is available for the state. Instead, the numbers being reported by the Department of Labor for California again are shown as an estimate pegged at the last count for the week of September 19. Because of the effect of California on the US numbers—27% of national PUA claims and 26% of initial claims in the regular program—conclusions from the national numbers have to be considered from this data issue as well.
Netting out the California estimates from the more relevant not seasonally adjusted numbers, initial claims for the rest of the country rose 13% as employers have been forced by extended closures to readjustment their rehiring plans and continue to shift temporary layoffs to permanent. PUA claims by the self-employed were down 25%, but primarily as the result of anti-fraud measures adopted in Arizona that produced a temporary halt in the processing of new claims. Combined initial claims in the rest of the US were little changed, easing only 2%.
Claims by Region
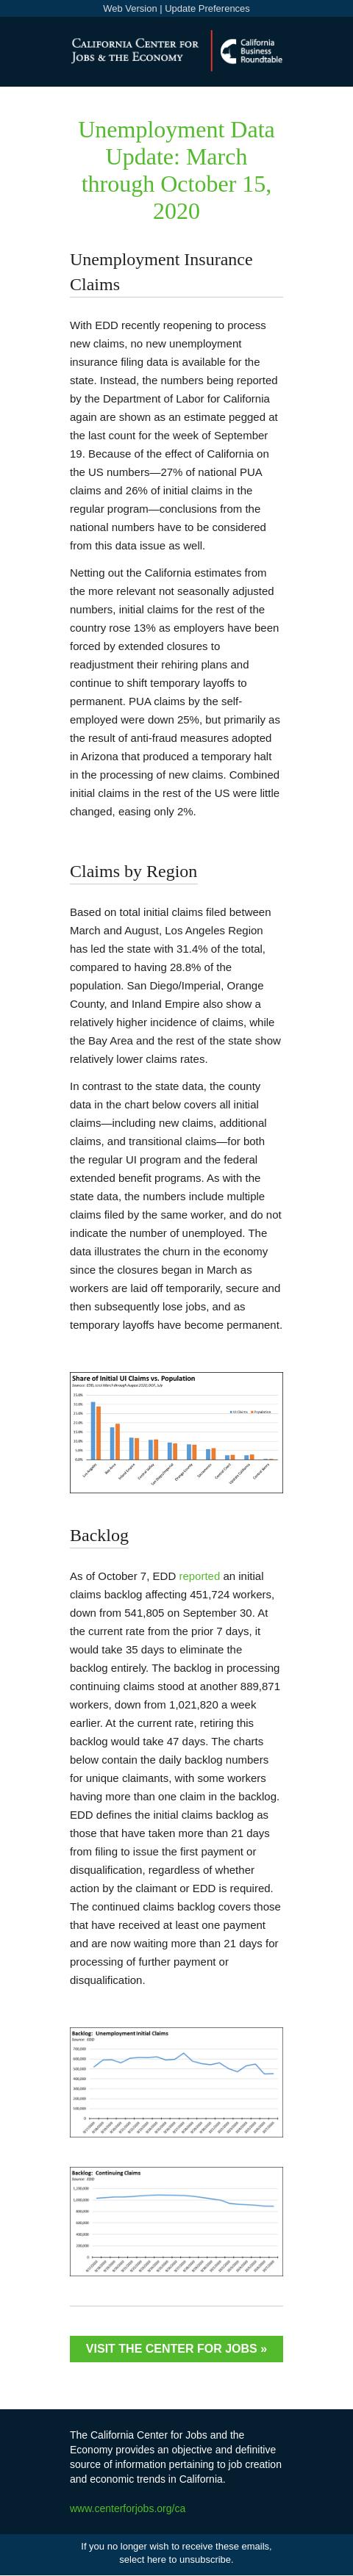
Based on total initial claims filed between March and August, Los Angeles Region has led the state with 31.4% of the total, compared to having 28.8% of the population. San Diego/Imperial, Orange County, and Inland Empire also show a relatively higher incidence of claims, while the Bay Area and the rest of the state show relatively lower claims rates.
In contrast to the state data, the county data in the chart below covers all initial claims—including new claims, additional claims, and transitional claims—for both the regular UI program and the federal extended benefit programs. As with the state data, the numbers include multiple claims filed by the same worker, and do not indicate the number of unemployed. The data illustrates the churn in the economy since the closures began in March as workers are laid off temporarily, secure and then subsequently lose jobs, and as temporary layoffs have become permanent.
Backlog
As of October 7, EDD reported [[link removed]] an initial claims backlog affecting 451,724 workers, down from 541,805 on September 30. At the current rate from the prior 7 days, it would take 35 days to eliminate the backlog entirely. The backlog in processing continuing claims stood at another 889,871 workers, down from 1,021,820 a week earlier. At the current rate, retiring this backlog would take 47 days. The charts below contain the daily backlog numbers for unique claimants, with some workers having more than one claim in the backlog. EDD defines the initial claims backlog as those that have taken more than 21 days from filing to issue the first payment or disqualification, regardless of whether action by the claimant or EDD is required. The continued claims backlog covers those that have received at least one payment and are now waiting more than 21 days for processing of further payment or disqualification.
Visit The Center For Jobs » [[link removed]] The California Center for Jobs and the Economy provides an objective and definitive source of information pertaining to job creation and economic trends in California. [[link removed]] Contact 1301 I Street Sacramento, CA 95814 916.553.4093 If you no longer wish to receive these emails, select here to unsubscribe. [link removed]
With EDD recently reopening to process new claims, no new unemployment insurance filing data is available for the state. Instead, the numbers being reported by the Department of Labor for California again are shown as an estimate pegged at the last count for the week of September 19. Because of the effect of California on the US numbers—27% of national PUA claims and 26% of initial claims in the regular program—conclusions from the national numbers have to be considered from this data issue as well.
Netting out the California estimates from the more relevant not seasonally adjusted numbers, initial claims for the rest of the country rose 13% as employers have been forced by extended closures to readjustment their rehiring plans and continue to shift temporary layoffs to permanent. PUA claims by the self-employed were down 25%, but primarily as the result of anti-fraud measures adopted in Arizona that produced a temporary halt in the processing of new claims. Combined initial claims in the rest of the US were little changed, easing only 2%.
Claims by Region
Based on total initial claims filed between March and August, Los Angeles Region has led the state with 31.4% of the total, compared to having 28.8% of the population. San Diego/Imperial, Orange County, and Inland Empire also show a relatively higher incidence of claims, while the Bay Area and the rest of the state show relatively lower claims rates.
In contrast to the state data, the county data in the chart below covers all initial claims—including new claims, additional claims, and transitional claims—for both the regular UI program and the federal extended benefit programs. As with the state data, the numbers include multiple claims filed by the same worker, and do not indicate the number of unemployed. The data illustrates the churn in the economy since the closures began in March as workers are laid off temporarily, secure and then subsequently lose jobs, and as temporary layoffs have become permanent.
Backlog
As of October 7, EDD reported [[link removed]] an initial claims backlog affecting 451,724 workers, down from 541,805 on September 30. At the current rate from the prior 7 days, it would take 35 days to eliminate the backlog entirely. The backlog in processing continuing claims stood at another 889,871 workers, down from 1,021,820 a week earlier. At the current rate, retiring this backlog would take 47 days. The charts below contain the daily backlog numbers for unique claimants, with some workers having more than one claim in the backlog. EDD defines the initial claims backlog as those that have taken more than 21 days from filing to issue the first payment or disqualification, regardless of whether action by the claimant or EDD is required. The continued claims backlog covers those that have received at least one payment and are now waiting more than 21 days for processing of further payment or disqualification.
Visit The Center For Jobs » [[link removed]] The California Center for Jobs and the Economy provides an objective and definitive source of information pertaining to job creation and economic trends in California. [[link removed]] Contact 1301 I Street Sacramento, CA 95814 916.553.4093 If you no longer wish to receive these emails, select here to unsubscribe. [link removed]
Message Analysis
- Sender: California Center for Jobs and the Economy
- Political Party: n/a
- Country: United States
- State/Locality: California
- Office: n/a
-
Email Providers:
- Campaign Monitor