| From | Center for Jobs and the Economy <[email protected]> |
| Subject | California Trade Report for August 2020 |
| Date | October 6, 2020 10:30 PM |
Links have been removed from this email. Learn more in the FAQ.
Links have been removed from this email. Learn more in the FAQ.
Web Version [link removed] | Update Preferences [link removed] [link removed] California Trade Report
for August 2020
Below are highlights from the recently released trade data from the US Census Bureau and US Bureau of Economic Analysis. To view additional data and analysis related to the California economy visit our website at [[link removed]].
Share of Goods through US Ports 17.7% CA Share of Total Trade Through US Ports
The share of total US goods trade (exports and imports) through California ports edged up to 17.66% (12 month moving average; compared to 17.58% in July 2020 and 17.87% in August 2019).
California remained the #1 state, ahead of Texas with 17.30% (compared to 17.40% in July 2020 and 17.73% in August 2019). Trade through the Atlantic port states was at 30.49% (compared to 30.39% in July 2020 and 29.65% in August 2019).
The state’s continued lead in this area forms the trade-related base for one of California’s largest centers of middle-class, blue-collar jobs. While down, Transportation & Warehousing alone provided 625,800 jobs in August (compared to 653,000 in August 2019), paying an average annual salary of $62.0k. This employment base in turn supports additional blue-collar and white-collar jobs in a range of other industries.
California Goods Exports Decrease -$1.9b Billions in Exports
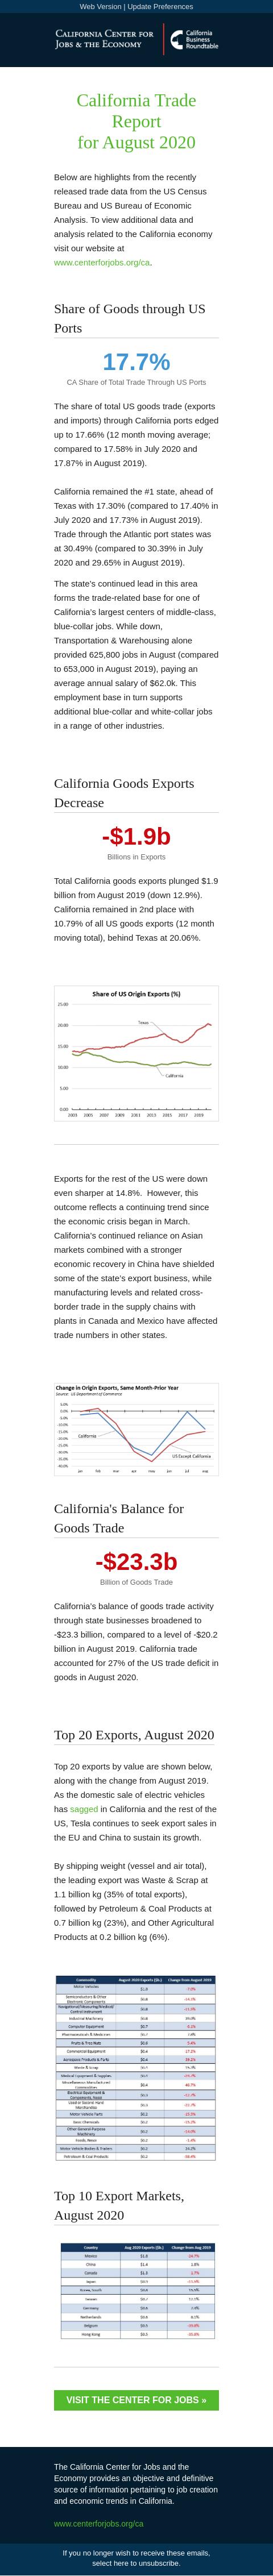
Total California goods exports plunged $1.9 billion from August 2019 (down 12.9%). California remained in 2nd place with 10.79% of all US goods exports (12 month moving total), behind Texas at 20.06%.
Exports for the rest of the US were down even sharper at 14.8%. However, this outcome reflects a continuing trend since the economic crisis began in March. California’s continued reliance on Asian markets combined with a stronger economic recovery in China have shielded some of the state’s export business, while manufacturing levels and related cross-border trade in the supply chains with plants in Canada and Mexico have affected trade numbers in other states.
California's Balance for Goods Trade -$23.3b Billion of Goods Trade
California’s balance of goods trade activity through state businesses broadened to -$23.3 billion, compared to a level of -$20.2 billion in August 2019. California trade accounted for 27% of the US trade deficit in goods in August 2020.
Top 20 Exports, August 2020
Top 20 exports by value are shown below, along with the change from August 2019. As the domestic sale of electric vehicles has sagged [[link removed]] in California and the rest of the US, Tesla continues to seek export sales in the EU and China to sustain its growth.
By shipping weight (vessel and air total), the leading export was Waste & Scrap at 1.1 billion kg (35% of total exports), followed by Petroleum & Coal Products at 0.7 billion kg (23%), and Other Agricultural Products at 0.2 billion kg (6%).
Top 10 Export Markets, August 2020 Visit the center for jobs » [[link removed]] The California Center for Jobs and the Economy provides an objective and definitive source of information pertaining to job creation and economic trends in California. [[link removed]] Contact 1301 I Street Sacramento, CA 95814 916.553.4093 If you no longer wish to receive these emails, select here to unsubscribe. [link removed]
for August 2020
Below are highlights from the recently released trade data from the US Census Bureau and US Bureau of Economic Analysis. To view additional data and analysis related to the California economy visit our website at [[link removed]].
Share of Goods through US Ports 17.7% CA Share of Total Trade Through US Ports
The share of total US goods trade (exports and imports) through California ports edged up to 17.66% (12 month moving average; compared to 17.58% in July 2020 and 17.87% in August 2019).
California remained the #1 state, ahead of Texas with 17.30% (compared to 17.40% in July 2020 and 17.73% in August 2019). Trade through the Atlantic port states was at 30.49% (compared to 30.39% in July 2020 and 29.65% in August 2019).
The state’s continued lead in this area forms the trade-related base for one of California’s largest centers of middle-class, blue-collar jobs. While down, Transportation & Warehousing alone provided 625,800 jobs in August (compared to 653,000 in August 2019), paying an average annual salary of $62.0k. This employment base in turn supports additional blue-collar and white-collar jobs in a range of other industries.
California Goods Exports Decrease -$1.9b Billions in Exports
Total California goods exports plunged $1.9 billion from August 2019 (down 12.9%). California remained in 2nd place with 10.79% of all US goods exports (12 month moving total), behind Texas at 20.06%.
Exports for the rest of the US were down even sharper at 14.8%. However, this outcome reflects a continuing trend since the economic crisis began in March. California’s continued reliance on Asian markets combined with a stronger economic recovery in China have shielded some of the state’s export business, while manufacturing levels and related cross-border trade in the supply chains with plants in Canada and Mexico have affected trade numbers in other states.
California's Balance for Goods Trade -$23.3b Billion of Goods Trade
California’s balance of goods trade activity through state businesses broadened to -$23.3 billion, compared to a level of -$20.2 billion in August 2019. California trade accounted for 27% of the US trade deficit in goods in August 2020.
Top 20 Exports, August 2020
Top 20 exports by value are shown below, along with the change from August 2019. As the domestic sale of electric vehicles has sagged [[link removed]] in California and the rest of the US, Tesla continues to seek export sales in the EU and China to sustain its growth.
By shipping weight (vessel and air total), the leading export was Waste & Scrap at 1.1 billion kg (35% of total exports), followed by Petroleum & Coal Products at 0.7 billion kg (23%), and Other Agricultural Products at 0.2 billion kg (6%).
Top 10 Export Markets, August 2020 Visit the center for jobs » [[link removed]] The California Center for Jobs and the Economy provides an objective and definitive source of information pertaining to job creation and economic trends in California. [[link removed]] Contact 1301 I Street Sacramento, CA 95814 916.553.4093 If you no longer wish to receive these emails, select here to unsubscribe. [link removed]
Message Analysis
- Sender: California Center for Jobs and the Economy
- Political Party: n/a
- Country: United States
- State/Locality: California
- Office: n/a
-
Email Providers:
- Campaign Monitor