| Unsubscribe |
Last week, Elon Musk said Tesla and SpaceX have formed committees to explore a merger. It could be the biggest corporate deal of all time.
Here's the part nobody mentions. Tesla has never paid its shareholders a dividend. Not one cent.
That's fine if you're 30 and can wait decades for the stock to climb.
But if you've got bills every month, decades is a long time to wait.
See the Tesla fund built to pay cash every month
It's an "upgraded" version of Tesla: a new kind of fund built on Tesla's stock. Instead of making you wait on the share price, it's made to pay out cash every month.
The upgraded Tesla paid a $452 monthly check on a $5,000 stake.
And Tesla itself pays nothing.
Elon keeps building, and the upgraded Tesla is built to pay cash along the way.
Tesla isn't the only one. There are upgraded versions of Apple, Amazon, Microsoft and Nvidia too, the same giants pouring billions into American factories.
CNBC reports a wave of these funds hitting the market. Bloomberg ties a retail boom to their "100% yields."
I was one of the first analysts to publicly track and recommend them. And I believe the biggest monthly checks could still be ahead.
Watch my free presentation: Tesla's monthly paycheck →
Tim Plaehn
P.S. Here's the trade-off, plainly. The cash comes at a price: less of Tesla's upside if the stock takes off, and payments that rise and fall each month. For anyone who needs income now, I think it's worth a look. Watch how the upgraded Tesla paid $452 on $5,000 , then decide for yourself.
L3Harris Stock Took a Beating—Is a 20% Rebound Next?
Reported by Thomas Hughes. Article Published: 11/1/2026.

Key Points
- L3Harris Technologies shares show a bullish trend-following signal after a 2026 correction, with technical indicators pointing to resistance tests near $300 to $320 within 12 months.
- The company reported strong Q3 results, with revenue up 7% to $6.1 billion and earnings per share of $3.28, both beating analyst consensus estimates significantly.
- Analysts maintained a roughly 25% upside consensus price target after Q3 earnings, supported by raised 2026 guidance, record backlog, and continued capital returns to shareholders.
- Special Report: The Untouched Energy Source Behind a New Eight Year Tax Break
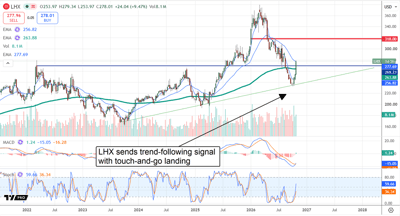
Despite its massive 2026 correction, L3Harris Technologies' (NYSE: LHX) stock price uptrend remains intact, as recent price action shows.
Backed by a solid earnings report, LHX made a touch-and-go landing on an existing trend line, generated a strong trend-following signal, and provided an entry point with high double-digit to triple-digit return potential.
Important crypto update: a strange split (Ad)
Something strange is happening with one crypto right now… Its price? Down. Dragged lower with the rest of the market.
But look under the hood... Its biggest revenue month ever just happened: over $14 million in September… New wallets hit a four-year high, right in the middle of the selloff… Wall Street just opened regulated futures on it… Price going one way. Fundamentals going the other.
This dip wasn’t caused by crypto. It came from Wall Street’s AI jitters, oil prices, and a nervous wait on the Fed. Meanwhile, this protocol keeps working.
Get our #1 dip-buying pick here.The stochastic and MACD indicators support this outlook. Both show bullish crossovers near the bottom of their ranges, aligning with the trend-following move and suggesting ample room for the stock to run. In this scenario, the next major hurdles are technical resistance in the $300 to $320 range and, beyond that, the existing highs, which are likely to be tested within the next 12 months.
L3Harris Q3 Earnings Beat and Record Backlog Strengthen the Bull Case
Analyst trends are closely tied to LHX’s stock price action. Midyear price target reductions weighed on market appetite, but that trend appears to be ending.
Initial analyst responses to L3Harris's Q3 results included cautious commentary on execution hurdles, but no price target reductions. Ratings were reaffirmed, helping stabilize the consensus price target.
After falling from its peak, the consensus forecast implied more than 20% upside as of late October, with a sufficient number of analysts covering the stock to support the estimate.
LHX’s Q3 results were strong, revealing broad-based growth, segment-specific strength in Space & Mission Systems, and scale-driven leverage in earnings and cash flow. Revenue grew 7% to $6.1 billion, beating consensus by 270 basis points (bps). Growth was driven by a 10.3% gain in Space and Mission Systems, a 3.1% gain in Communications and Spectrum Dominance, and a 4.9% increase in Missile Solutions.
Margins were a strength. The company logged a 200-basis-point improvement in GAAP operating margin, driving a 26.6% increase in operating income and comparable growth in the bottom line. Earnings per share of $3.28 beat estimates by more than 1,000 bps and grew more than 30% year over year to a quarterly record. More importantly, cash flow was strong at $1.4 billion, nearly 23% of revenue, while free cash flow (FCF) reached $1.26 billion, driving 195% year-over-year FCF growth.
Guidance was strong and may be cautious, given the underlying performance and ongoing global conflicts. Management raised its revenue and earnings targets, with a particularly significant increase to its earnings outlook, putting both above consensus forecasts. For full-year 2026, L3Harris now expects earnings of $12.25 to $12.35 per share, with even the low end exceeding analysts’ $11.90 consensus estimate.
Reasons to believe the guidance may be cautious include $19.3 billion in new orders, a record backlog, and a 3.2-to-1 book-to-bill ratio. This metric shows that new orders are coming in at more than three times the rate of sales.
Capital Returns Provide Lift to LHX Shares
LHX’s share buybacks have slowed due to government scrutiny but have not ceased, while the company’s capacity to repurchase shares has improved. Q3 buybacks helped reduce the share count marginally over the trailing 12 months, and the company returned about 24% of quarterly free cash flow to shareholders through dividends and share repurchases.
Cash, current assets, and total assets all grew during the quarter, while liabilities increased at a slower pace, boosting shareholders’ equity and strengthening the balance sheet. The company also pays a quarterly dividend of $1.25 per share, or $5 annually, providing an additional source of shareholder returns.
Institutions played a role in LHX’s stock price correction and now underpin the upswing. The group owns about 85% of the shares, giving it an outsized influence on the stock’s direction. Institutions were net sellers in Q1 and Q2 as the share price corrected, then returned to a bullish posture in Q3 and early Q4 ahead of the earnings release. They may continue to provide support and buy dips, but they could also cap upside by selling into rallies as the stock approaches resistance at $300, $320, and $360.
The market misjudged LHX’s near-term headwinds: They do not reflect structural decay or a business implosion, but rather growing pains that may lead to improved results. The market has started to get the pipeline and backlog right, as shown by clear Q3 strength.
Q3 strength points to sustained growth, acceleration, and cash flow to fuel capital returns. Upcoming catalysts include the potential spin-off of non-core assets gained through acquisitions. These transactions could reduce the balance sheet burden, generate cash, and allow management to focus on growth pillars, including space and next-generation defense applications.
Valuation and short selling are not issues right now. With earnings improving and backlogs swelling, LHX may still offer upside as its recovery gains momentum. Short sellers may have been blamed for the correction, but MarketBeat data shows low single-digit short interest, which is insufficient to affect price action.
NXP Semiconductors Falls After Strong Earnings—Is the Sell-Off Overdone?
Reported by Thomas Hughes. Article Published: 10/29/2026.

Key Points
- NXP Semiconductors' stock dropped on cautious Q4 guidance, but analysts argue the sell-off overlooks a strong underlying business.
- Q3 results showed 19.3% revenue growth, expanding margins, $1.21 billion in free cash flow, and a $5 billion increase to the buyback program.
- Despite mixed guidance, consensus price targets imply roughly 20% upside, supported by heavy institutional ownership.
- Special Report: The Untouched Energy Source Behind a New Eight Year Tax Break
Investors looking at NXP Semiconductors’ (NASDAQ: NXPI) “weak” Q4 guidance and the subsequent stock price decline may think now is a good time to get out, but they’re getting it all wrong. Wall Street set the bar so high that guidance calling for 15% year-over-year revenue growth is being treated as a disappointment.
Since NXP Semiconductors’ last earnings report in July, nearly every analyst revision has been bullish, with commentary focused on the AI buildout, NXP’s position in NVIDIA’s (NASDAQ: NVDA) ecosystem, and the company’s long-term growth potential.
Shocking AI prediction from the "Billionaire Whisperer" (Ad)
Marc Chaikin's Power Gauge system flagged Micron before it soared 970 percent, Celestica before a 6,600 percent run, and Nvidia before it climbed more than 50,000 percent.
Now Chaikin says a new AI data center technology using 99 percent less electricity, water, and space could accelerate scientific breakthroughs 360-fold, and one company behind it just flashed bullish in his system.
See the full research and the ticker Chaikin is watching before this presentation goes offline.
Watch Chaikin's free presentation and see the ticker nowThe mixed Q4 outlook overshadows the company’s strengths, pushing the stock lower and creating a buying opportunity in a highly profitable, capital-returning business.
Highlights from the Q3 release included significantly wider margins, accelerated earnings growth, ample free cash flow, and a $5 billion increase in the share buyback authorization. The increase reflects the board’s confidence in cash flow and sets the stage for sustained share count reduction. NXP Semiconductors doesn’t buy shares aggressively; instead, it steadily reduces its share count each quarter. The result is steadily improving per-share metrics, which can help drive stock price gains.
NXP’s Strong Q3 Overshadowed by Mixed Q4 Guidance
NXP Semiconductors posted a strong quarter, with revenue up 19.3% to $3.79 billion, slightly beating consensus. Revenue rose 8% sequentially, supported by growth in all but one segment.
Communications, which includes the data center business, led with a 54% advance, while Industrial/IoT grew 39% and Automotive rose 13%. Mobile was the lone weak spot, down 4%, but the decline could have been worse. The mobile business is struggling industrywide, as carriers shift away from the subsidies that supported device sales and supply chain issues compound the problem.
Margin news could have been a catalyst for the share price if not for the guidance. Margins expanded at both the gross and operating levels, driving accelerated earnings growth and adjusted earnings per share (EPS) of $4.20. Adjusted gross profit grew 22%, operating income rose 31%, and adjusted net income increased 35%. Cash flow topped $1.25 billion, with a 96% free cash flow (FCF) conversion rate. FCF exceeded $1.21 billion, more than enough to cover the $359 million in combined capital returns.
Guidance is the hurdle for the share price in Q4. Management forecast sequential growth, 15% year-over-year revenue growth, and widening margins. The bad news is that analysts had expected more on the top line; the good news is that the EPS forecast was better than expected and business strengths are expected to persist into 2027.
The balance sheet raises no red flags and offers clear reasons for optimism, with cash, assets, and equity up and total debt, net debt, and liabilities down. Equity improved 20% year over year (YOY), while leverage fell to 1.3x.
Analysts Respond With Caution, Strengthen Outlook for 20% Upside
Analysts responded cautiously to the release, citing the guidance miss and expected Q4 slowdown. Initial responses included several price target cuts and some increases. KeyCorp lowered its price target to $330, still 10% above the consensus forecast. As of late October, consensus pointed to solid upside of 20%, with the stock near its all-time high.
This year’s catalysts include accelerating adoption of software-defined vehicles, a reacceleration in automotive and industrial end markets, margin strength, and buybacks. Software-defined vehicles are gaining traction globally, with Volkswagen (OTCMKTS: VWAGY) and others choosing NXPI’s microcontrollers to power onboard architectures.
The biggest risks are the company’s legacy businesses, which are winding down and facing margin compression, as well as tariffs and supply chain exposure. The company has significant exposure to international supply chains: it is headquartered in Europe, does more than 25% of its business in the U.S., and conducts more than 60% of its business in Asia.
Institutional activity is a factor investors should note. Institutions own more than 90% of the stock, reflecting strong confidence, and have aggressively accumulated shares in the mid-$200 range. If the company’s capital returns or growth were in danger, the data would tell a different story.

The charts likewise reflect institutional interest, with clear support along the 150-week exponential moving average (EMA). Investors can use it as a buying trigger, accumulating shares when the price reverts to the EMA and taking profits when it extends to overbought levels.
This email content is a sponsored message provided by Investors Alley, a third-party advertiser of InsiderTrades.com and MarketBeat.
If you need help with your newsletter, please email our support team, based in South Dakota, at [email protected].
If you no longer wish to receive email from InsiderTrades.com, you can unsubscribe.
© 2006-2026 MarketBeat Media, LLC.
345 N Reid Pl., Suite 620, Sioux Falls, SD 57103-7078. United States..