| From | Center for Jobs and the Economy <[email protected]> |
| Subject | 2019 Supplemental Poverty Rate Measure Released |
| Date | September 15, 2020 9:30 PM |
Links have been removed from this email. Learn more in the FAQ.
Links have been removed from this email. Learn more in the FAQ.
Web Version [link removed] | Update Preferences [link removed] [link removed] 2019 Supplemental Poverty Rate Measure Released
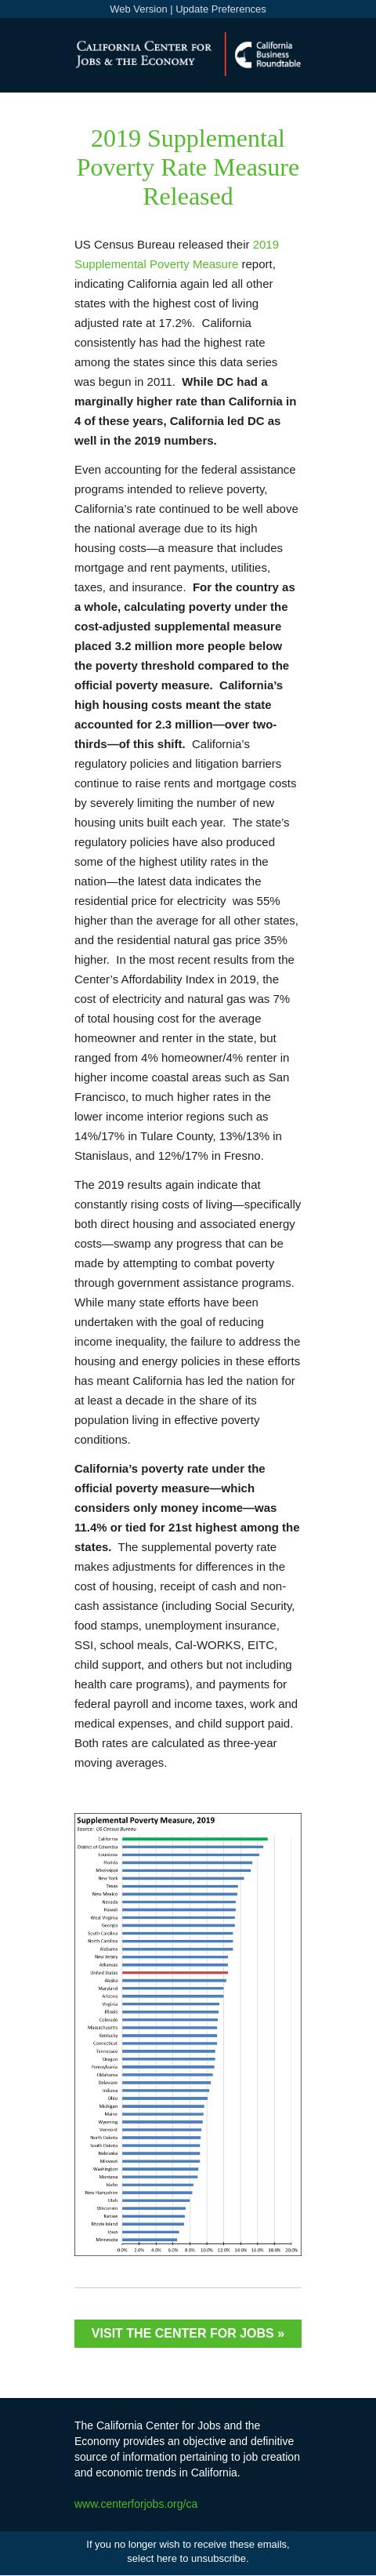
US Census Bureau released their 2019 Supplemental Poverty Measure [[link removed]] report, indicating California again led all other states with the highest cost of living adjusted rate at 17.2%. California consistently has had the highest rate among the states since this data series was begun in 2011. While DC had a marginally higher rate than California in 4 of these years, California led DC as well in the 2019 numbers.
Even accounting for the federal assistance programs intended to relieve poverty, California’s rate continued to be well above the national average due to its high housing costs—a measure that includes mortgage and rent payments, utilities, taxes, and insurance. For the country as a whole, calculating poverty under the cost-adjusted supplemental measure placed 3.2 million more people below the poverty threshold compared to the official poverty measure. California’s high housing costs meant the state accounted for 2.3 million—over two-thirds—of this shift. California’s regulatory policies and litigation barriers continue to raise rents and mortgage costs by severely limiting the number of new housing units built each year. The state’s regulatory policies have also produced some of the highest utility rates in the nation—the latest data indicates the residential price for electricity was 55% higher than the average for all other states, and the residential natural gas price 35% higher. In the most recent results from the Center’s Affordability Index in 2019, the cost of electricity and natural gas was 7% of total housing cost for the average homeowner and renter in the state, but ranged from 4% homeowner/4% renter in higher income coastal areas such as San Francisco, to much higher rates in the lower income interior regions such as 14%/17% in Tulare County, 13%/13% in Stanislaus, and 12%/17% in Fresno.
The 2019 results again indicate that constantly rising costs of living—specifically both direct housing and associated energy costs—swamp any progress that can be made by attempting to combat poverty through government assistance programs. While many state efforts have been undertaken with the goal of reducing income inequality, the failure to address the housing and energy policies in these efforts has meant California has led the nation for at least a decade in the share of its population living in effective poverty conditions.
California’s poverty rate under the official poverty measure—which considers only money income—was 11.4% or tied for 21st highest among the states. The supplemental poverty rate makes adjustments for differences in the cost of housing, receipt of cash and non-cash assistance (including Social Security, food stamps, unemployment insurance, SSI, school meals, Cal-WORKS, EITC, child support, and others but not including health care programs), and payments for federal payroll and income taxes, work and medical expenses, and child support paid. Both rates are calculated as three-year moving averages.
Visit The Center For Jobs » [[link removed]] The California Center for Jobs and the Economy provides an objective and definitive source of information pertaining to job creation and economic trends in California. [[link removed]] Contact 1301 I Street Sacramento, CA 95814 916.553.4093 If you no longer wish to receive these emails, select here to unsubscribe. [link removed]
Message Analysis
- Sender: California Center for Jobs and the Economy
- Political Party: n/a
- Country: United States
- State/Locality: California
- Office: n/a
-
Email Providers:
- Campaign Monitor