 Editor’s Note: Jeff Brown and Marc Chaikin, two investment legends who picked Nvidia 10 years ago, are predicting that by the end of this month, Elon Musk’s new AI breakthrough will collide with a strange market pattern with a flawless 100% track record of massive market gains. Click here to see the details or read more below because the last time this happened everyday folks had a chance to turn $10,000 into as much as $350,000 in just about 12 months.
Dear Reader, The two investment legends who picked Nvidia 10 years ago… Just issued a shocking new AI prediction involving the world’s first trillionaire. They believe that by the end of this month… Elon Musk’s new AI breakthrough they call “M.A.G.I.”... Will collide with a strange market pattern with a flawless 100% track record of massive market gains. Click here to see the details because the last time this happened… Everyday folks had a chance to turn $10,000 into as much as $350,000 in just about 12 months. Regards, Lindsey Hough
Managing Director, Brownstone Research
Additional Reading from MarketBeat Media Costco’s Secret Growth Engine May Be Running Out of GasWritten by Dan Schmidt. Posted: 6/28/2026. 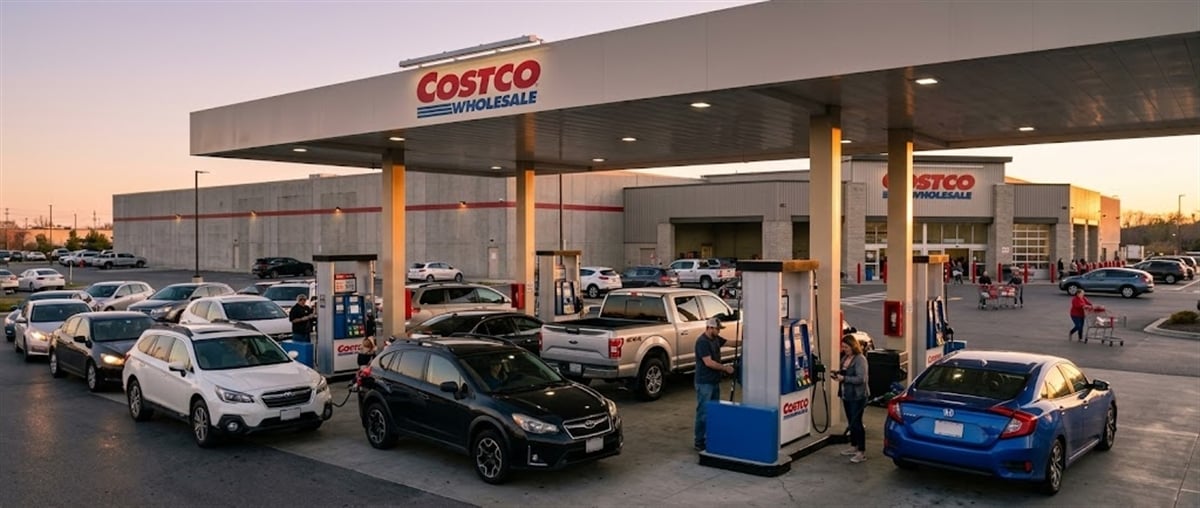
Key Points- Costco's comparable sales growth was significantly inflated by high gas prices, with fuel-adjusted comps running roughly 4 to 5 percentage points below reported figures.
- COST shares fell more than 10% from their May 19 all-time high of $1,096 as gas prices retreated, breaking below the 50-day moving average in early June.
- Bulls point to Costco's 90% membership retention rates as a durable growth driver, but the stock's 46x forward earnings valuation leaves little margin for a slowdown.
- Special Report: This Startup Could Be the Next Netflix
The Iran war caused many price spikes across the commodity spectrum, and consumers felt one of the most immediate effects every time they needed to fill up their tanks. Gas prices are posted at nearly every intersection and street corner, serving as a painful daily reminder of shrinking purchasing power. One company that turned that spike into a windfall was Costco Wholesale Corp. (NASDAQ: COST). Rising numbers on gas price signs became flashing billboards for the company, which sells gas at razor-thin margins to attract new members and drive store traffic. However, retail gasoline prices have begun to pull back from their late-May highs, and front-month RBOB gasoline futures have fallen even more sharply. That suggests the fuel-price tailwind Costco enjoyed may be nearing an end, even if the full effect has not yet shown up at the pump. Can Costco continue drawing record numbers of members, or will normalization in oil and gas prices limit the impact of its traffic-driving strategy? Fading Macro Tailwind Forces Results to Stand on Their OwnThe charts for average retail gas prices and COST shares have been nearly mirror images over the past month. COST notched its latest all-time high of $1,096 on May 19, the day after gas prices peaked in the United States. But the stock is now down more than 10% from that high, and the gas-driven growth tailwind is starting to fade. The key question is whether Costco’s recent growth reflects durable store-level demand or a temporary boost from higher fuel sales. Comparable sales, or comps, help answer that because they measure sales at stores open for more than one year, excluding the noise from new openings and closures. On the surface, Costco’s trend looked powerful, with comps rising 9.4% in March, 11.6% in April, and 12.5% in May year over year. But the headline numbers need context. Costco also reports comparable sales excluding the impact of gasoline prices and currency fluctuations, and those adjusted figures showed a more moderate trend. Excluding those factors, comps rose 6.2% in March, 7.8% in April, and 8.0% in May. That still points to healthy demand, but it also shows how much the fuel-price environment helped amplify Costco’s reported sales growth. Record-high gas volume did drive organic sales growth, but the pace of that growth appears to be approaching a ceiling. The bear case is fairly simple: the gas tailwind is fading, and comp sales growth will likely have peaked by the time June numbers are released. The bull case is that these new ‘recruits’ have become part of a membership base that consistently reports 90% retention rates, and that added membership revenue, combined with margin growth from declining gas prices, will show the stock is still worth its premium valuation. However, that valuation continues to weigh on the stock, which now trades at about 46x forward earnings. Stock May Have Found Short-Term Bottom, But Momentum Remains WeakIt’s already been a tumultuous year for COST shares following a parabolic run in early January. The stock’s long-term technical outlook remains positive, but several indicators are wavering in ways they had not yet shown in 2026. The 50-day moving average had been a strong support level for the stock price ever since it crossed above the 200-day moving average in March, forming a bullish signal known as a Golden Cross. The share price traded in a tight range for two months following the Golden Cross, but other indicators, such as the Relative Strength Index (RSI), confirmed that the trend remained bullish and buyers were in control. 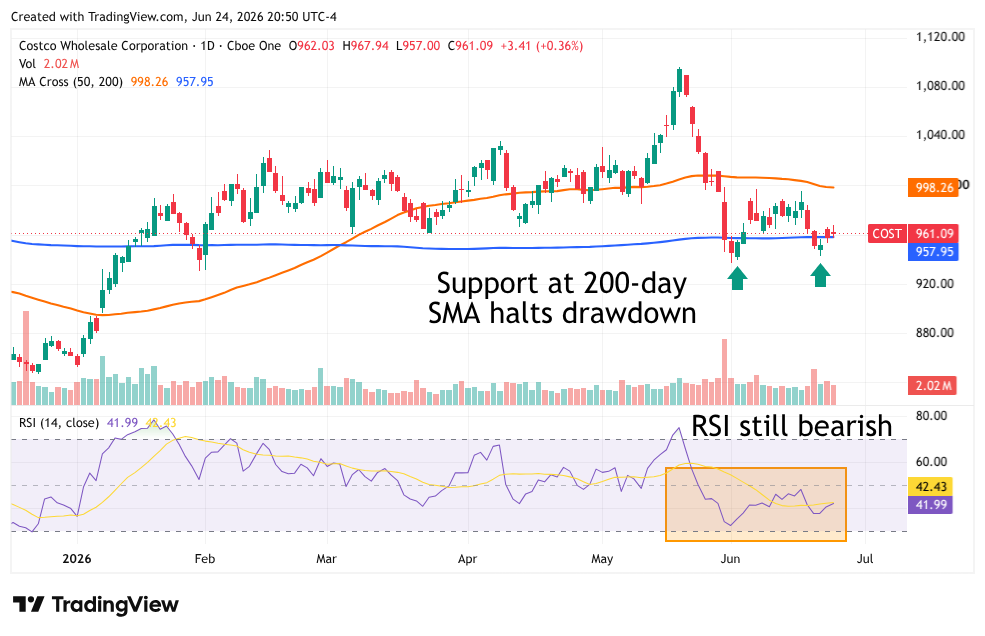
As gas prices approached their peak in mid-May, COST shares broke out of that tight range and soared to a new all-time high. But the reversal came just as quickly as the breakout. Once gas prices began retreating, COST shares followed, falling below the 50-day moving average during a volatile first week of June. The RSI dipped below the bullish threshold of 50 during the drawdown, and the price is now testing the 200-day moving average for the first time since early February. The stock has found new support at the 200-day moving average, but this action looks more like a digestion period than a buyable bottom. The gas tailwinds are starting to unwind, and Costco will need to post blowout earnings numbers to prove it is still worth paying 46x forward earnings for a stock with retailer margins. An RSI move back above 50 will likely be the first clue that buying momentum has resumed, and the stock will need to move back above the 50-day moving average before any sustained breakout can occur. The market will get a better read on how quickly the gas tailwind is fading when June sales figures are released in the first week of July, but the holding pattern for COST investors is likely to continue until the next earnings report arrives on Sept. 24. . | 