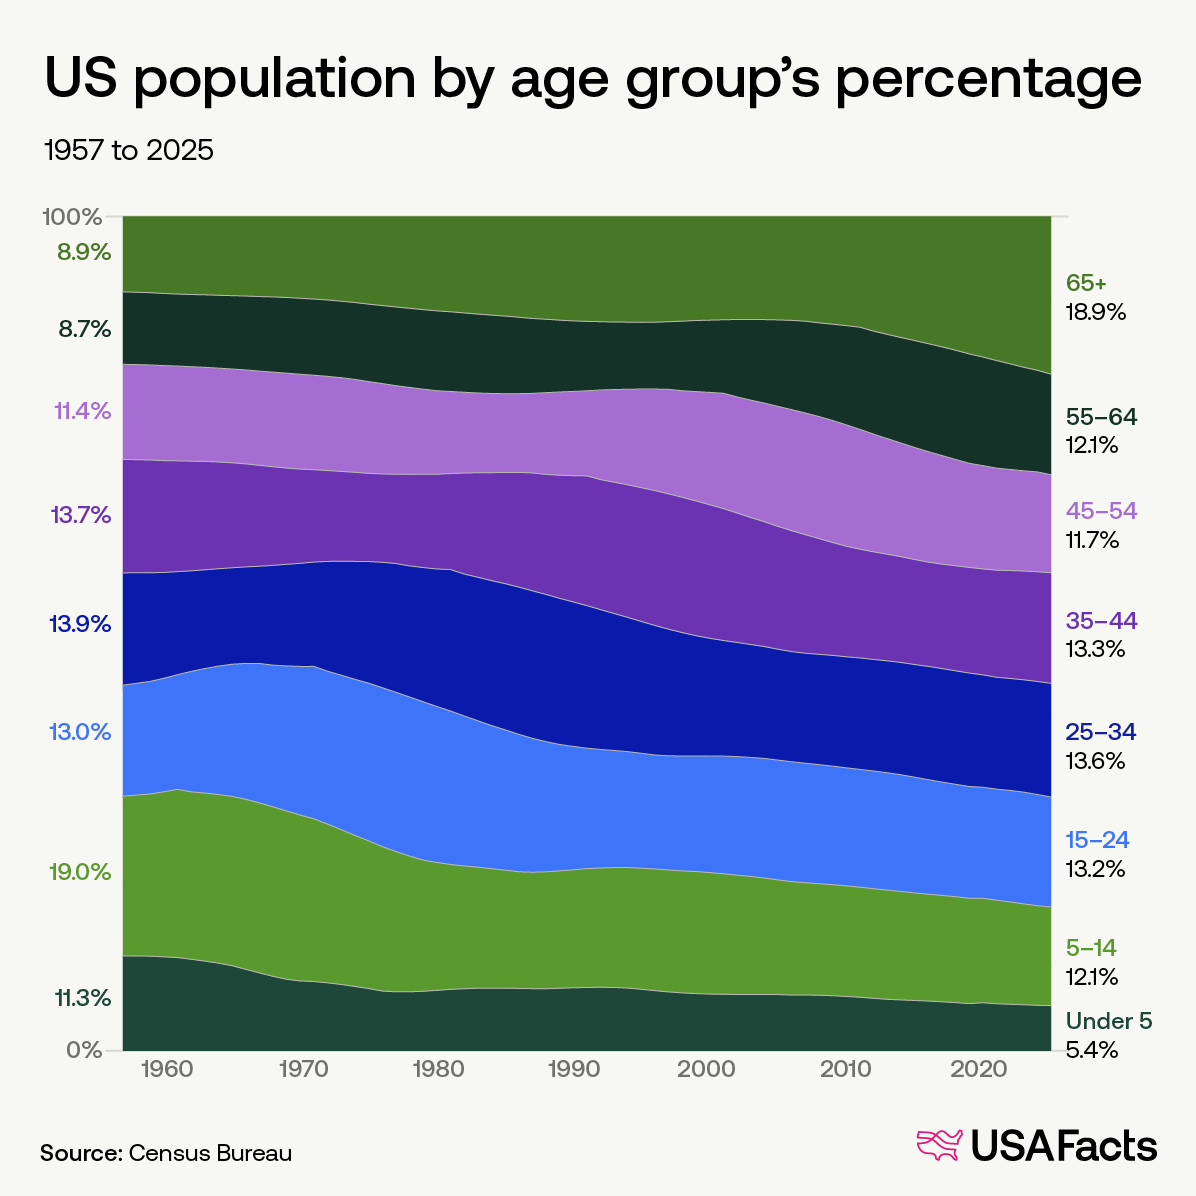
America’s population is aging The country’s largest age group is people who are 65 and older. Last year, 18.9% of people in the US, or nearly one in five, were in this age group. The number of births in the US hit a record high in 1957: 4.3 million. These babies turned 65 in 2022.
|
|
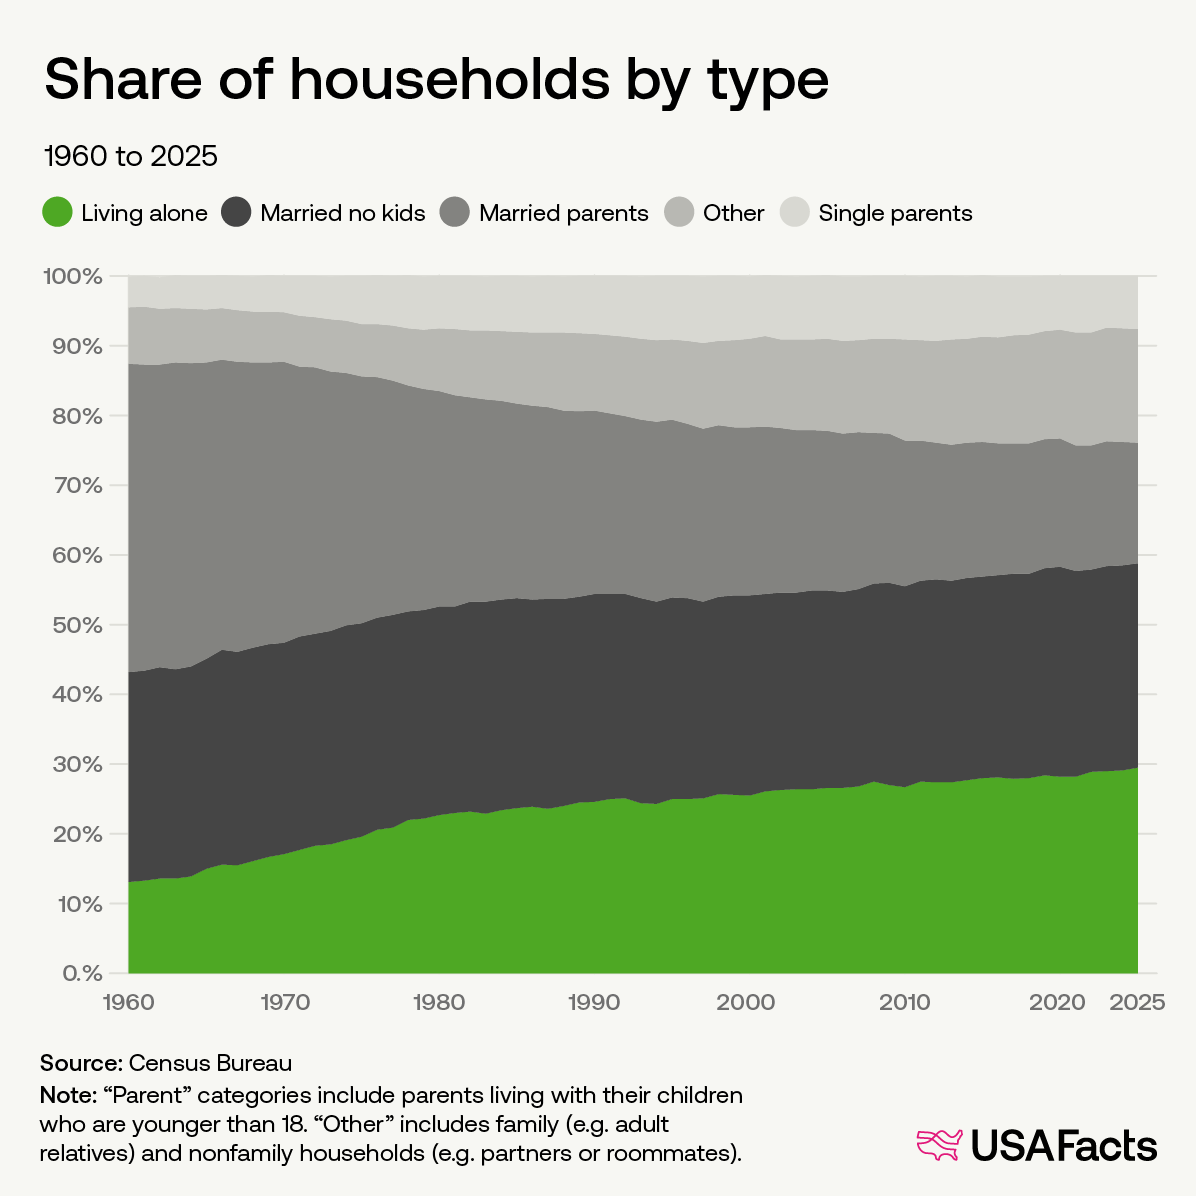
More people are living alone In recent decades, the most common type of US household has been those headed by a married couple without children under 18 in the home. But last year, people living alone comprised the largest share of households (29.5%) for the first time. Nearly three out of every 10 people lived on their own.
|
|
Married couples without children under 18 were the second-largest group, accounting for 29.3% of households. This includes both married couples with children older than 18 (even if they live at home) and married couples without any children.
Married parents headed 17.3% of households, while single parents headed 7.6%.
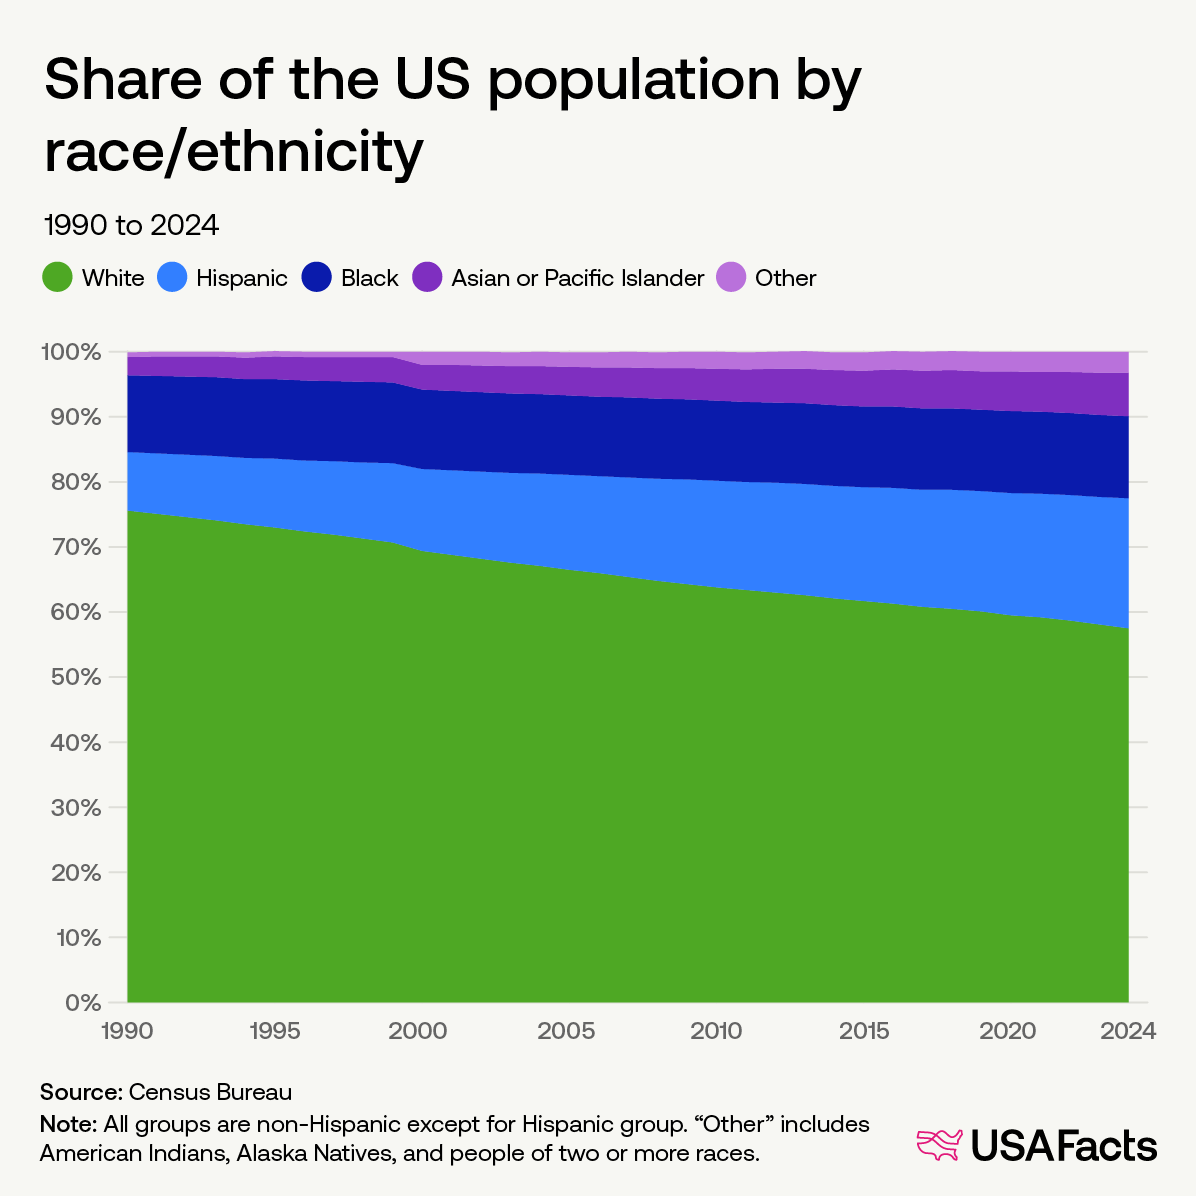
The population’s getting more diverse In 1990, 75.6% of people in the US identified as white and non-Hispanic. By 2024, 57.5% did, a difference of 18.1 percentage points.
The share of all other racial and ethnic groups, as measured in the census, increased over the same period. The Hispanic share of the population more than doubled from 9.0% to 20.0%, making it the nation’s second-largest racial or ethnic group.
|
|
In 2024, 12.6% of people in the US identified as Black and 6.7% as Asian or Pacific Islander. Another 3.2% identified as “other,” a category that includes American Indians, Alaska Natives, and people who report identifying with two or more races.
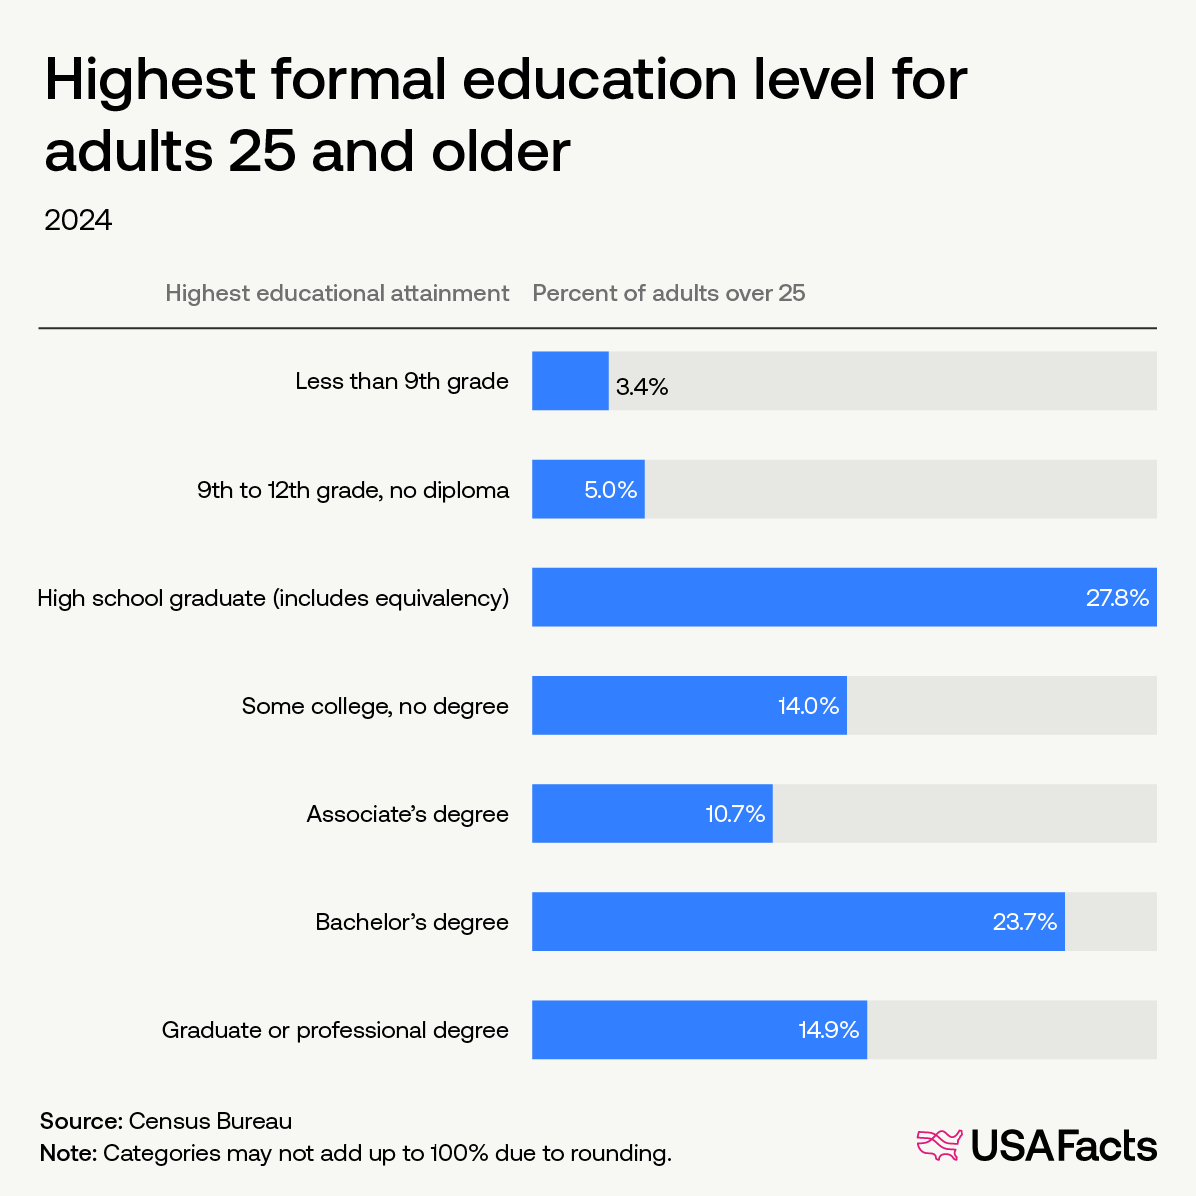
Neary 50% of adults have a college education In 2024, 49.3% of people who were 25 or older held a postsecondary degree. The largest percentage of people had a bachelor’s degree as their highest level of education (23.7%), and the second-largest was a graduate or professional degree (14.9%).
Another 27.8% had completed high school, while 8.4% had less than a complete high school education.
|
|
Household income The median household income nationwide was $81,600 in 2024. (Household income is the total money received in a year — wages, pensions, investments, public assistance, and more — by everyone in a household older than 15.)
|
|
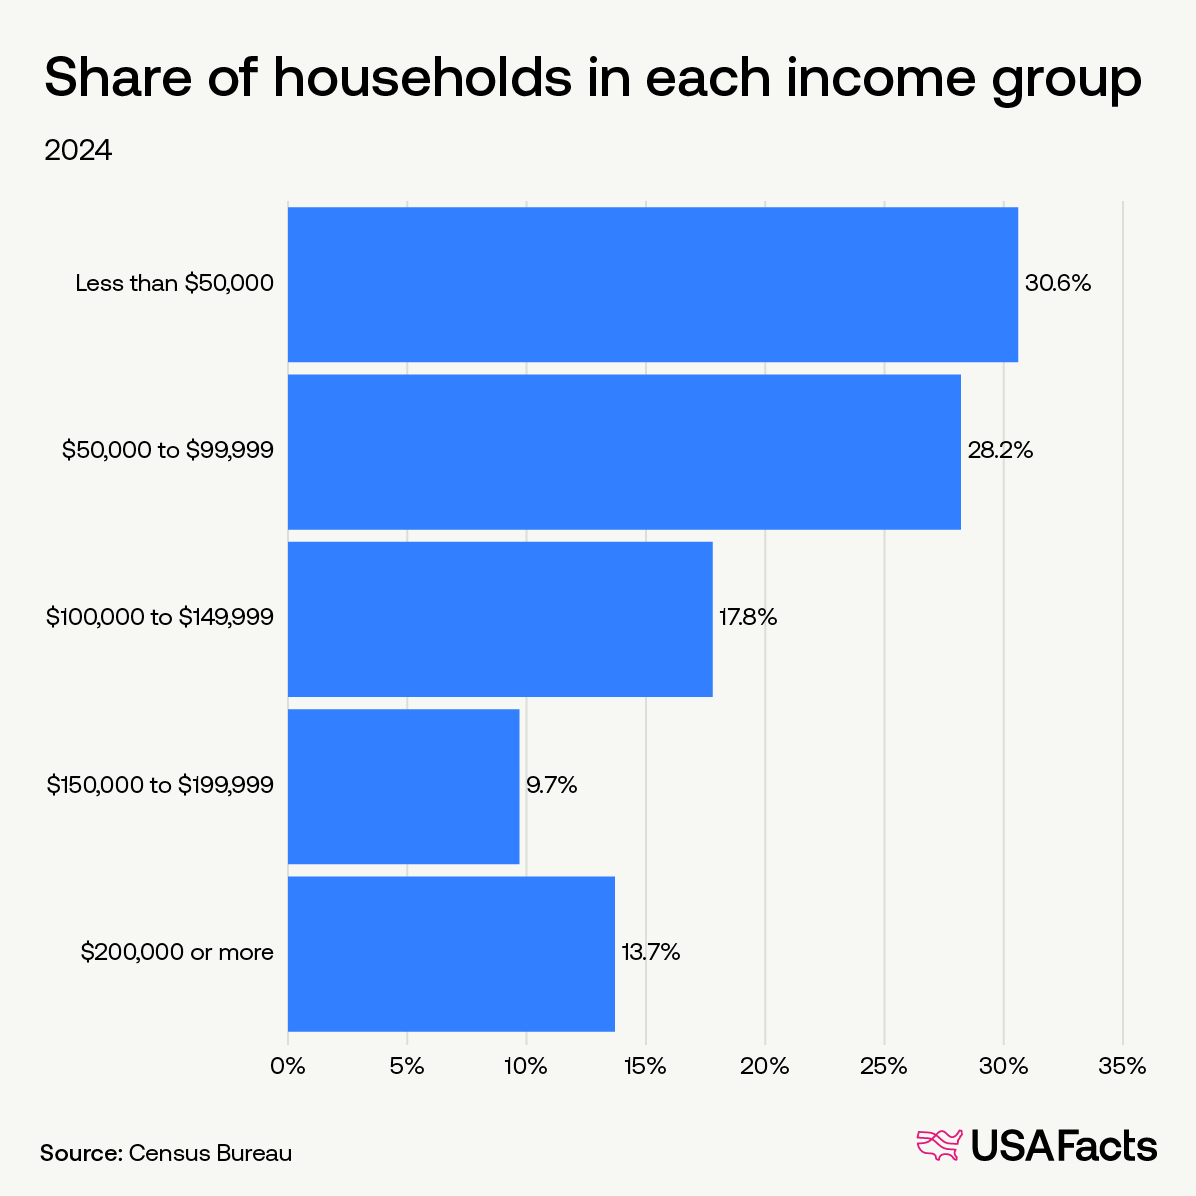
That same year, 41.2% of households made $100,000 or more, 28.2% made between $50,000 and $99,999, and 30.6% made less than $50,000.
|
|
What do you get a nation for its 250th? Better data. |
|
Data is the love letter we send to our future selves. It makes so many things easier. Roads in your neighborhood getting repaired? Thank government data. Ever need to go on unemployment? Bureau of Labor Statistics data helps make that possible. Are there enough kilowatts available to cool your house in the summer? Again, government data. Yet the nation’s outdated data infrastructure doesn’t meet modern needs. Join us in telling Congress to update the ways it collects and uses this crucial information. It’s your 250th birthday, America! Treat yo self! |
|
Twenty-five states, along with Washington, DC, are suing the Trump administration over new Medicaid work requirements. These requirements were introduced in last year’s One Big Beautiful Bill Act. The Supreme Court, in its recent ruling on National Republican Senatorial Committee v. Federal Election Commission (FEC), rolled back federal restrictions on how much political committees can spend in coordination with federal candidates. Learn more about the independent FEC. See how well you know the data with the weekly fact quiz. |
|
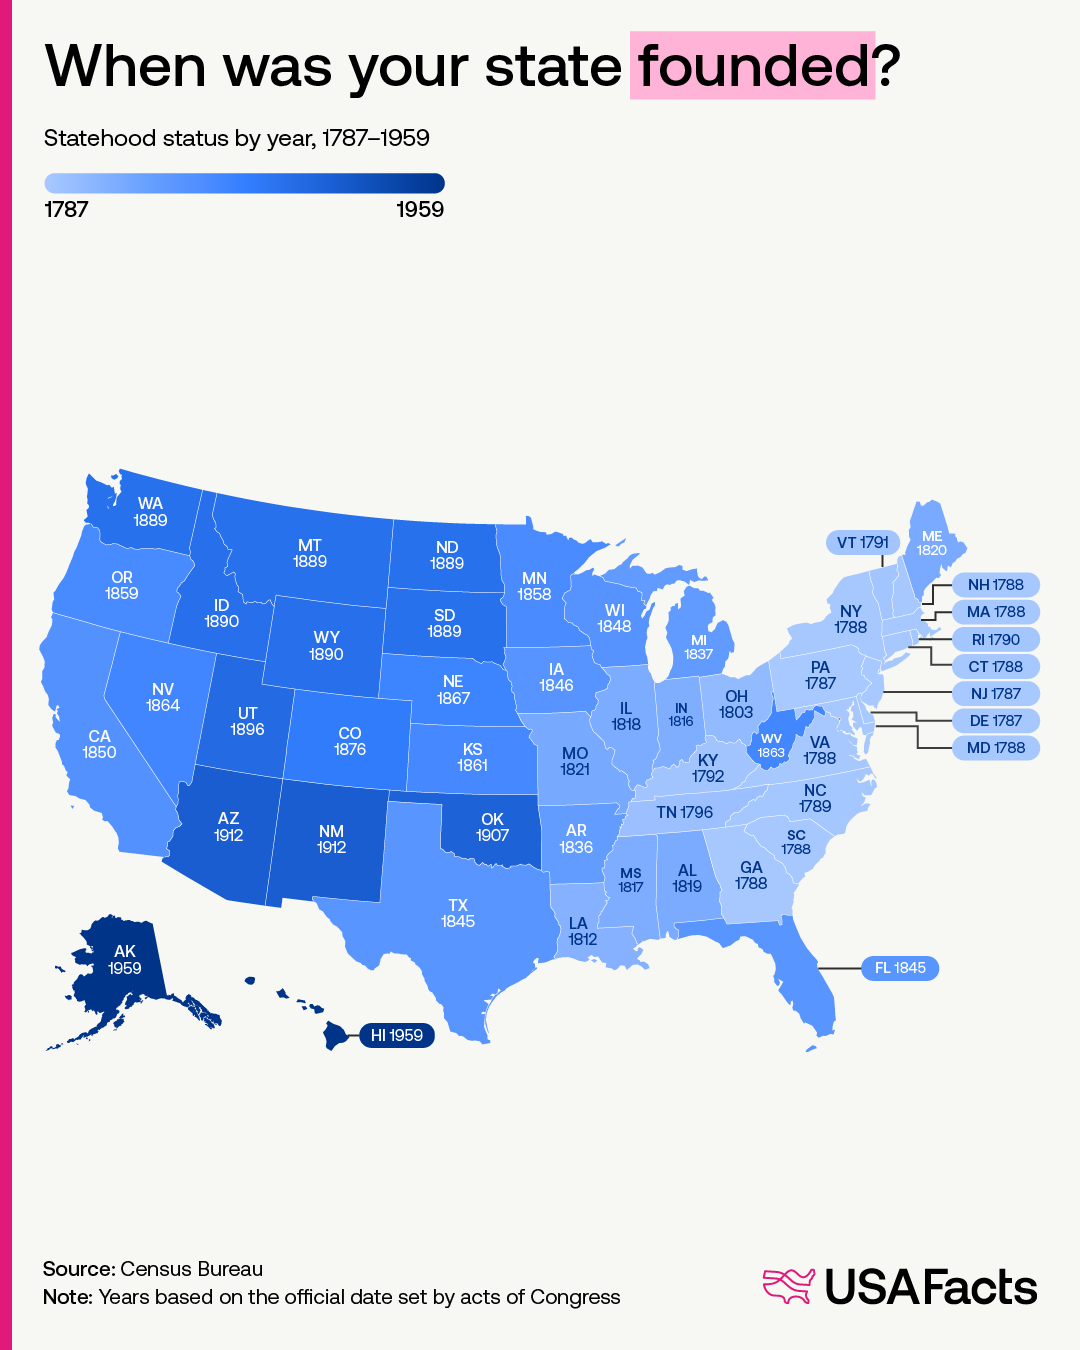
The Constitution gives Congress the sole authority to admit new states to the union. Most states form by drafting a state constitution and submitting it for Congressional approval. Once approved, it passes an Act of Admission, which the president signs, officially granting statehood. Sixteen states formed in the 18th century, 29 in the 19th century, and five in the 20th century. When was your state founded? |
|
|
|
|