Dear Reader,
In 1929, Wall Street was throwing the biggest party in history.
The Dow Jones was setting new records every month. People were literally jumping over each other to invest in any stock they could. Even shoeshine boys were handing out stock tips.
But a young, 20-something stockbroker named Irving Weiss noticed something even veteran brokers didn’t.
Irving noticed that the numbers behind America’s largest companies painted a completely different picture. He saw a massive, systemic crisis forming beneath the surface of the "Roaring Twenties."
So he did something completely unthinkable. He borrowed $500 from his friends and family and shorted the entire stock market.
A few months later, Black Monday hit. The average stock lost 90% of its value. But Irving Weiss made a fortune.
Then in the 1970s, his son Martin took over the reins of the firm. He took the formulas his father used to predict the 1929 crash, and digitized them into a proprietary ratings system.
Today, that system is known as Weiss Ratings. This system performs tracks 22,000 publicly traded stocks and performs 1.2 billion daily calculations.
It’s the exact same system that called the bank failures of the 1980s, the Dot-Com bust, the 2008 financial crisis, and the 2020 crash.
And right now, for the first time in years … that same system is flashing "Code Red."
Because just like in 1929, Wall Street is ignoring the $38 trillion national debt. They’re ignoring the oil surge and inflation shock set to be triggered by the conflict in the Middle East.
But our ratings don’t ignore or overlook stuff.
In fact, our system just issued an urgent "Must-Sell" warning on 10 extremely popular, widely-held US stocks.
Our system indicates that when this debt crisis hits the market, these 10 stocks will be the first to collapse.
At the same time, it just upgraded 3 under-the-radar companies to an urgent "Buy."
I’ve recorded a special market briefing detailing exactly how this 100-year-old system works, and what it’s telling us to do with our money today.
Click here to watch the briefing and get the names of the 3 "Buy" stocks absolutely free

Chris Graebe
Weiss Ratings
This Golden Cross Could Send Urban Outfitters to New Highs
Authored by Thomas Hughes. Article Posted: 6/16/2026.

Key Points
- Urban Outfitters' strong results underpin a stock price uptrend that has yet to play out.
- Technical signals include Golden Crosses and potential for a $100 stock price by year's end.
- Sell-side forces are aligned with the trend and may provide explosive upside when catalysts emerge.
- Special Report: The company SpaceX cannot operate without
Urban Outfitters (NASDAQ: URBN) was identified through one of MarketBeat's premier stock analysis tools.
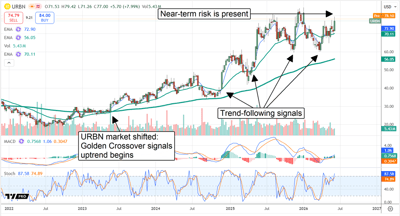
The Golden Crossovers screen highlights stocks whose moving averages suggest a potential shift in market momentum. A Golden Cross occurs when a stock's short-term moving average rises above its longer-term moving average—a technical signal that many investors interpret as the start of a sustained upward trend.
ALERT: Drop these 5 stocks before the market opens tomorrow! (Ad)
The Wall Street Journal is already raising the alarm about a potential market crash, and Weiss Ratings research points to the first half of 2026 as a particularly rough stretch for certain holdings.
Some of America's most popular stocks could take serious damage as a radical market shift plays out. Analysts at Weiss Ratings have identified five names you may want to remove from your portfolio before this unfolds.
If any of these are in your portfolio, now is the time to review your positions.
See the 5 stocks to avoidUrban Outfitters has been in the midst of this signal for years. Emerging in 2023, the original Golden Cross was unusual in that it involved not two but three critical exponential moving averages (EMAs), resulting in a sustained uptrend. The story as of mid-2026 is that the trend remains intact and the stock is rebounding in a textbook trend-following entry, with its own Golden Cross. This time, the cross involves only two EMAs, but it is no less meaningful given the price action that preceded it and the forces underlying it.
Urban Outfitters Accelerates in Q1: Momentum Builds
Urban Outfitters had a solid Q1 earnings report, outperforming on both the top and bottom lines thanks to strength across brands and channels. Revenue of $1.48 billion grew by more than 11%, accelerating sequentially and year over year to a company record. The strength was supported by digital sales and Nuuly, the company’s fashion rental business. Nuuly has been surprisingly strong, allowing consumers to rent apparel for a fixed monthly rate. For Urban Outfitters, the result is a growing, visible, recurring revenue stream and higher margins.
Margins and profitability are central to URBN’s stock price outlook. The company is widening margins as revenue growth accelerates, driving better-than-expected profitability and cash flow. Outperformance was evident in earnings, but the critical details were cash flow, free cash flow, and the capital returns they enable. Free cash flow allowed a 5% year-over-year reduction in average Q1 share count and is expected to remain solid in upcoming quarters.
Urban Outfitters’ balance sheet reflects its strength and cash generation. Q1 highlights include a slight reduction in cash and equivalents, offset by increases in inventory, current assets, and property. Liabilities also increased, but only marginally, leaving equity higher despite the aggressive buybacks. Equity increased by more than 800 basis points, putting total liabilities well below 1X and leaving the business in fortress-like condition. Looking ahead, unencumbered free cash flow will likely be directed toward additional buybacks.
URBN: Near-Term Headwinds Provide Volatility in Early 2026
However robust Urban Outfitters’ business and capital return outlook may be, there are risks for investors to consider. The primary technical risk is resistance at $80. The market has failed to break through that level twice, once in Q4 2025 and again at year-end and into New Year 2026, and may struggle there again. In this scenario, URBN stock would remain range-bound, with resistance near $80 and support near $60, and likely continue moving sideways until later in the year. However, analysts indicate a move to new highs, so a more bullish outcome is more likely.
Analysts' mixed response to URBN’s Q1 release is another risk, though one with limited bearish implications. The four analyst revisions MarketBeat tracked following the report include a reaffirmed target below consensus and one reduced target. However, a price target reduction to $100 merely lowered the high end, still forecasting nearly 30% upside and a fresh all-time high. A move to the $87.18 consensus, which is trending higher in 2026, would also be sufficient to set a fresh all-time high.
Institutional activity also aligns with URBN’s volatility in 2026. While the group bought throughout 2025, pushing price action to record levels, it reverted to selling in Q1 2026, helping cap gains. Early indications suggest institutions returned to accumulation in Q2, helping support prices and limit downside risk. The likely outcome is that this group continues to buy on dips but may not chase price action to new highs until a new catalyst emerges.
Short-sellers are likewise a risk to near-term price action. MarketBeat data shows moderately high short interest of 12% as of early June, enough to limit upside in the absence of a strong bullish catalyst. The risk is that they sell into rallies, capping gains at the $80 level. Catalysts for short-covering would include sustained strength, accelerating growth, margin gains, buybacks, and a move in URBN stock above $80.
Urban to $100: An Easy Move Once Fresh Highs Are Set
Urban’s move to $100 is all but assured; the signs suggest it is only a matter of time as growth, cash flow, capital returns, and sell-side sentiment strengthen. Technical indications suggest $100 is a base-case target; the existing range is worth $20, and $20 projected from $80 is $100. The bull case suggests this market can advance by more than 30% in the near to mid-term and then continue rallying.
Micron’s HBM Surge Could Redefine the AI Growth Story
Authored by Thomas Hughes. Article Posted: 6/25/2026.

Key Points
- Micron reported fiscal Q3 revenue of $41.46 billion, up 345% year over year and roughly 1,550 basis points above consensus estimates.
- Strong HBM demand, with new supply not expected to meaningfully impact the market until 2028, supports sustained hypergrowth over the next six to eight quarters.
- Micron's Q4 revenue guidance of $50 billion and expected adjusted EPS exceeding $31 both came in well above analyst expectations, driving shares up more than 15%.
- Special Report: The company SpaceX cannot operate without
Micron’s (NASDAQ: MU) fiscal Q3 results and the strength of its outperformance highlight a persistent problem in today’s market: there is a fundamental misunderstanding of the AI trade. AI isn’t a niche; it’s not a bubble. It is the evolution of technology, and that evolution is accelerating.
Leading tech giants, enterprises, and research labs worldwide are racing to implement existing infrastructure and unlock the next generation in a virtuous cycle that could unfold over years, if not decades.
ALERT: Drop these 5 stocks before the market opens tomorrow! (Ad)
The Wall Street Journal is already raising the alarm about a potential market crash, and Weiss Ratings research points to the first half of 2026 as a particularly rough stretch for certain holdings.
Some of America's most popular stocks could take serious damage as a radical market shift plays out. Analysts at Weiss Ratings have identified five names you may want to remove from your portfolio before this unfolds.
If any of these are in your portfolio, now is the time to review your positions.
See the 5 stocks to avoidThe impact on Micron is substantial, as it is a primary source of high-bandwidth memory (HBM) stacks, a component found in most GPUs designed for heavy AI training and other advanced workloads. The critical detail is that each NVIDIA (NASDAQ: NVDA) GPU uses six to 16 stacks of HBM, and each stack is six to 12 chips high, making demand for Micron’s product grow geometrically relative to the underlying AI GPU market.
The takeaway is that HBM markets are sold out, with new supply not expected to meaningfully impact the market until sometime in 2028. Until then, Micron is riding a wave of excess demand and pricing that is driving accelerating hypergrowth and an outlook for sustained strength over the coming six to eight quarters.
Micron, Growing Faster Than NVIDIA, Accelerates
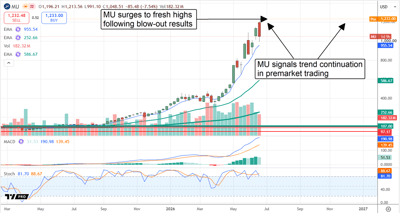
NVIDIA set the gold standard for AI growth, topping out at 265% in Q4 2024, but Micron just lifted the bar. The company's fiscal Q3 revenue of $41.46 billion was not only up 345% from the prior year, but also nearly 1,550 basis points (bps) above MarketBeat’s reported consensus estimate. Strength was seen across all segments, each growing by an average of approximately 375%, led by Cloud and Datacenter, which account for more than 60% of the business. Cloud Memory grew by 300% and Datacenter by 650%, with Mobile & Client up 250% and Automotive & Embedded up 310%.
Margin news was also strong. The revenue surge drove improvements across the stack, despite higher costs and capital expenditures. Critical details include operating cash flow, which more than doubled sequentially and quadrupled year over year (YOY), and adjusted free cash flow, which grew by approximately 9X to over $18 billion. Adjusted earnings per share (EPS), the marketwide benchmark for earnings quality, grew by 13X to over $25, nearly $5, or 2,000 bps, better than expected.
Guidance is the catalyst for this market, as it forecasts another quarter with similar sequential growth, margin strength, and earnings. The revenue forecast of $50 billion was more than 1,600 bps better than expected, compounded by an even hotter outlook for earnings. Earnings are expected to exceed $31, further strengthening the company’s financial position.
Micron’s War Chest Swells: Debt Falls
Micron’s business windfall is clearly reflected in its balance sheet highlights. The company’s cash balance swelled, up approximately 160% YOY, to top $30 billion, including investments and restricted cash. While liabilities also increased, they did so at a much slower pace, offset by a substantial debt reduction that left equity higher. Looking ahead, cash flow is expected to remain robust for at least the next two years, barring any unforeseeable technological advancements, suggesting further cash and equity gains in the coming periods.
Analyst trends will likely strengthen now that fiscal Q3 results and fiscal Q4 guidance have been released. As it stands, the trends are robustly bullish, including numerous price target boosts in the weeks leading up to the earnings release. The consensus of 39 analysts is a Buy, with a 90% Buy-side bias in the data, and a price target of $1,103. However, it is not the average price target that matters; it is the trend. June revisions pushed the high end of price targets toward $2,000, representing a 100% increase in stock price from the pre-release closing price.
Looking at Micron on a valuation basis, MU stock remains deeply undervalued based on the pre-release earnings outlook. The post-release earnings outlook makes the value even more compelling, suggesting this stock could easily rise by 200% to 300% in the near term and more over the long term. Micron’s biggest risk is industry cyclicality and the potential for oversupply, but that is a problem for the future. Supply-and-demand metrics, the timeline for capacity expansions, and analysts' commentary suggest there is little risk of oversupply at this time. The more likely scenario is that undersupply persists well into 2028 and potentially longer.
Price action reflects the strength of the results and guidance, indicating the uptrend will likely continue. MU shares gained more than 15% to hit fresh highs following the release, amid rising market momentum. In this scenario, MU shares will likely continue higher and may accelerate. Not only is the outlook robust, but FOMO may set in across the market, spurring sidelined cash to move.
This email is a paid advertisement provided by Weiss Ratings, a third-party advertiser of InsiderTrades.com and MarketBeat.
11780 US Highway 1,
Palm Beach Gardens, FL 33408-3080
Would you like to edit your e-mail notification preferences or unsubscribe from our mailing list?
Copyright © 2026 Weiss Ratings. All rights reserved.
If you have questions about your newsletter, please don't hesitate to contact MarketBeat's U.S. based support team at [email protected].
If you no longer wish to receive email from InsiderTrades.com, you can unsubscribe.
© 2006-2026 MarketBeat Media, LLC. All rights protected.
345 North Reid Place, Sixth Floor, Sioux Falls, S.D. 57103. United States of America..