| From | Center for Jobs and the Economy <[email protected]> |
| Subject | California Trade Report for March 2026 |
| Date | May 5, 2026 11:03 PM |
Links have been removed from this email. Learn more in the FAQ.
Links have been removed from this email. Learn more in the FAQ.
Web Version [link removed] | Update Preferences [link removed] [link removed] California Trade Report
for March 2026
Below are highlights from the recently released trade data from the US Census Bureau and US Bureau of Economic Analysis. To view additional data and analysis related to the California economy visit our website at www.centerforjobs.org/ca.
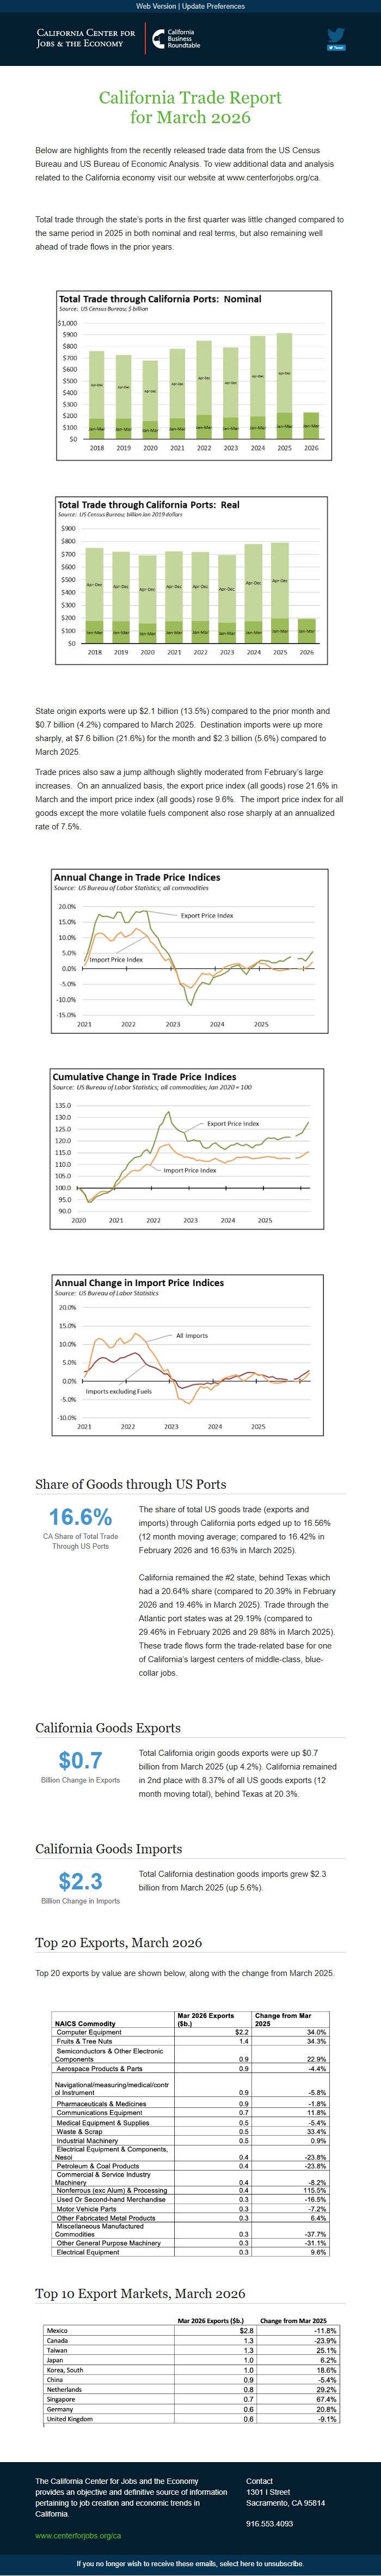
Total trade through the state’s ports in the first quarter was little changed compared to the same period in 2025 in both nominal and real terms, but also remaining well ahead of trade flows in the prior years.
State origin exports were up $2.1 billion (13.5%) compared to the prior month and $0.7 billion (4.2%) compared to March 2025. Destination imports were up more sharply, at $7.6 billion (21.6%) for the month and $2.3 billion (5.6%) compared to March 2025.
Trade prices also saw a jump although slightly moderated from February’s large increases. On an annualized basis, the export price index (all goods) rose 21.6% in March and the import price index (all goods) rose 9.6%. The import price index for all goods except the more volatile fuels component also rose sharply at an annualized rate of 7.5%.
Share of Goods through US Ports 16.6% CA Share of Total Trade Through US Ports
The share of total US goods trade (exports and imports) through California ports edged up to 16.56% (12 month moving average; compared to 16.42% in February 2026 and 16.63% in March 2025).
California remained the #2 state, behind Texas which had a 20.64% share (compared to 20.39% in February 2026 and 19.46% in March 2025). Trade through the Atlantic port states was at 29.19% (compared to 29.46% in February 2026 and 29.88% in March 2025). These trade flows form the trade-related base for one of California’s largest centers of middle-class, blue-collar jobs.
California Goods Exports $0.7 Billion Change in Exports
Total California origin goods exports were up $0.7 billion from March 2025 (up 4.2%). California remained in 2nd place with 8.37% of all US goods exports (12 month moving total), behind Texas at 20.3%.
California Goods Imports $2.3 Billion Change in Imports
Total California destination goods imports grew $2.3 billion from March 2025 (up 5.6%).
Top 20 Exports, March 2026
Top 20 exports by value are shown below, along with the change from March 2025.
Top 10 Export Markets, March 2026 The California Center for Jobs and the Economy provides an objective and definitive source of information pertaining to job creation and economic trends in California. [[link removed]] Contact 1301 I Street Sacramento, CA 95814 916.553.4093 If you no longer wish to receive these emails, select here to unsubscribe. [link removed]
for March 2026
Below are highlights from the recently released trade data from the US Census Bureau and US Bureau of Economic Analysis. To view additional data and analysis related to the California economy visit our website at www.centerforjobs.org/ca.
Total trade through the state’s ports in the first quarter was little changed compared to the same period in 2025 in both nominal and real terms, but also remaining well ahead of trade flows in the prior years.
State origin exports were up $2.1 billion (13.5%) compared to the prior month and $0.7 billion (4.2%) compared to March 2025. Destination imports were up more sharply, at $7.6 billion (21.6%) for the month and $2.3 billion (5.6%) compared to March 2025.
Trade prices also saw a jump although slightly moderated from February’s large increases. On an annualized basis, the export price index (all goods) rose 21.6% in March and the import price index (all goods) rose 9.6%. The import price index for all goods except the more volatile fuels component also rose sharply at an annualized rate of 7.5%.
Share of Goods through US Ports 16.6% CA Share of Total Trade Through US Ports
The share of total US goods trade (exports and imports) through California ports edged up to 16.56% (12 month moving average; compared to 16.42% in February 2026 and 16.63% in March 2025).
California remained the #2 state, behind Texas which had a 20.64% share (compared to 20.39% in February 2026 and 19.46% in March 2025). Trade through the Atlantic port states was at 29.19% (compared to 29.46% in February 2026 and 29.88% in March 2025). These trade flows form the trade-related base for one of California’s largest centers of middle-class, blue-collar jobs.
California Goods Exports $0.7 Billion Change in Exports
Total California origin goods exports were up $0.7 billion from March 2025 (up 4.2%). California remained in 2nd place with 8.37% of all US goods exports (12 month moving total), behind Texas at 20.3%.
California Goods Imports $2.3 Billion Change in Imports
Total California destination goods imports grew $2.3 billion from March 2025 (up 5.6%).
Top 20 Exports, March 2026
Top 20 exports by value are shown below, along with the change from March 2025.
Top 10 Export Markets, March 2026 The California Center for Jobs and the Economy provides an objective and definitive source of information pertaining to job creation and economic trends in California. [[link removed]] Contact 1301 I Street Sacramento, CA 95814 916.553.4093 If you no longer wish to receive these emails, select here to unsubscribe. [link removed]
Message Analysis
- Sender: California Center for Jobs and the Economy
- Political Party: n/a
- Country: United States
- State/Locality: California
- Office: n/a
-
Email Providers:
- Campaign Monitor