Below is an important message from one of our highly valued sponsors. Please read it carefully as they have some special information to share with you.
Dear reader,
President Trump has made some pretty bold geopolitical moves recently…
He arrested the Venezuelan president at his own home…
Took control of the country’s oil…
And killed the entire leadership of Iran.
A lot of folks think he forgot about the US economy…
But Jim Rickards just showed me this hand-written letter from President Trump that…
And it proves that’s not true.
It reveals Trump’s secret plan for the economy… and how he’s set to pull the trigger on May 15.
You need to prepare now because…
The Financial Times estimates this new Trump move could help unleash $100 trillion in new wealth.
Click here to see the details because some of the best investors on the planet are already preparing…
I’m talking about people like billionaire John Paulson…
Ray Dalio, the founder of the world’s largest hedge fund…
And legendary trader Paul Tudor Jones, who became famous after he had five consecutive years of 100%+ returns.
Click here to get the details because the stakes couldn't be any higher.
President Trump himself has said, and I quote…
“This is a great time to get rich, richer than ever before!!!”
Regards,
Matt Insley
Publisher, Paradigm Press
PepsiCo Stock Reversal Points Toward New All-Time Highs
Authored by Thomas Hughes. Article Published: 4/16/2026.

Key Points
- PepsiCo's stock price reversal gained momentum after Q1 results showed improving business trends.
- Cash flow and capital returns are reliable and expected to improve in the coming year.
- Analysts and institutions underpin the market action, pointing to fresh all-time highs by year's end.
- Special Report: Have $500? Invest in Elon’s AI Masterplan
PepsiCo’s (NASDAQ: PEP) stock price hit bottom in mid-2025 and began to reverse course after years of end-market normalization, as company-specific headwinds eased and the impacts of turnaround efforts began to show traction.
That traction — revenue growth and margin improvement — continued through subsequent quarters and strengthened in fiscal Q1 2026, when the turnaround story gained further momentum.
The REAL Reason Trump is Invading Iran (Ad)
For a moment…
Forget about Trump’s ties to Israel.
Forget about reports of Iran’s nuclear program.
Because my research has led me to believe we’re risking World War 3 with Iran for a completely different reason.
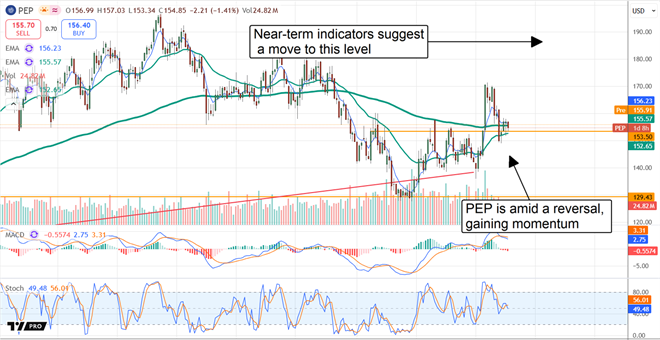
Click here to find out what it is.Q1 results beat expectations, revealing strength in core and growth markets. The stock's price action confirmed support at a critical level near $153.50, indicating the reversal is in full force and likely to continue as the year progresses. That level aligns with prior resistance and the baseline of a Head & Shoulders reversal pattern. A Head & Shoulders pattern typically forms as a low, followed by a lower low, then a higher low, and is not confirmed until the baseline is decisively broken.
The baseline is a pivot point: when price action moves above it, it signals a shift in market dynamics from distribution to accumulation. Head & Shoulders patterns carry weight with technical traders because they often lead to short-term rallies roughly equal to the pattern's magnitude, and can precede longer-term uptrends when supported by fundamentals. In this case, PepsiCo appears positioned to sustain growth over the next several years, meaning its uptrend can continue until the outlook changes.
PepsiCo on Track for New All-Time Highs This Year
PepsiCo’s reversal pattern measures roughly $24, running from a low near $129.50 to the $153.50 baseline. Projecting that dollar amount from the baseline yields a target near $177.50; projecting the percentage move (about 18%) yields a target near $181.15. That target range corresponds to roughly 18-month highs for this market and could be achievable given the stock’s valuation as of mid-April 2026.
Trading near $155, PEP is priced at under 18X forward earnings — roughly six points below par. Given that relative undervaluation, PepsiCo’s stock could potentially advance more than $50 to exceed $200 in the near- to mid-term, establishing a fresh all-time high. Over a longer horizon, the stock is trading below 12X on a 2035 forecast, a level that appears conservative and implies substantial upside over time.
Institutional activity supports the view that the mid-2025 bottom is a strong floor. While the stock could correct if a negative catalyst emerges, institutions are likely to step in to buy as long as fundamentals remain intact. Institutions own more than 70% of the shares and have been net accumulators for eight consecutive quarters. Notably, activity ramped in Q1 2026 to a multi-year high, with the balance running above $3 bought for each $1 sold — a powerful tailwind that is likely to persist into Q2 and beyond.
Analysts are also constructive on PepsiCo and could provide a catalyst for higher prices in Q2. The group of 20 analysts tracked by MarketBeat rates the stock a consensus Moderate Buy, with a 40% Buy-side bias. The consensus price target implied roughly 10% upside at the time of release, although some recent price target reductions have capped gains at the high end.
A broader market catalyst would be a return to more bullish analyst actions, including price-target increases and upgrades. For now, consensus sentiment and price targets have remained relatively stable on a trailing 12-month basis despite active revisions, reflecting persistent conviction at current levels.
PepsiCo Grows and Outperforms in Q1: Capital Returns Are Safe and Reliable
PepsiCo delivered a solid quarter, with 8.5% revenue growth supported by 2.6% organic growth, 2.5% acquisitional growth, and a 3.4% currency tailwind. Both total revenue and organic growth accelerated sequentially and outpaced last year's levels, driven by strength across all segments. Europe, the Middle East, and APAC led with about 7% growth, with notable gains in International Beverage Franchise, Latin America, and core U.S. markets.
Growth was helped by brand investments and pricing initiatives that preserved affordability; importantly, pricing dynamics contributed to volume growth in key categories and aided systemwide margin expansion. Operating margin improved by 210 basis points, and adjusted EPS came in at $1.61 — a 9% increase that outpaced revenue growth and topped expectations by more than a nickel.
Investors should also note the strength of cash flow and its implications for capital returns. Net income approached $2.3 billion for the quarter, enough to cover the dividend and leave the company financially sound. Dividends yield about 3.65% annualized, and repurchases totaled nearly $2.1 billion, modestly reducing the share count versus the prior year. Balance-sheet highlights show no red flags: quarterly activity increased cash, assets, and equity, with long-term debt around 2X equity.
3 ETFs to Own If a U.S.-India Trade Deal Succeeds (Plus a Bonus)
Submitted by Nathan Reiff. Article Posted: 4/25/2026.

Key Points
- India's economy is projected to grow by 6.6% in fiscal 2027 and could be buoyed by a potential trade agreement with the U.S. government.
- While accessing individual Indian stocks can be tricky for U.S. investors, India-focused ETFs make building exposure much more straightforward.
- EPI, SMIN, and INDH offer varying strategies that may appeal to different investors seeking to bulk up their exposure to Indian equities.
- Special Report: Have $500? Invest in Elon’s AI Masterplan
The United States and India are continuing negotiations toward an agreement aiming for $500 billion in bilateral trade by 2030, although as of mid‑April 2026 no official deal has been reached. A deal could bring lower U.S. tariffs on Indian goods and increased flows of industrial, agricultural and technology products.
Even without a finalized agreement, investors who expect a positive outcome may still have time to build positions in companies that would benefit. A mutually beneficial trade arrangement could further boost India’s economy — despite an anticipated slowdown partly attributed to higher oil prices related to the Iran war — with the world’s most populous country forecast to grow about 6.6% in fiscal 2027. That momentum could lift many Indian companies.
The REAL Reason Trump is Invading Iran (Ad)
For a moment…
Forget about Trump’s ties to Israel.
Forget about reports of Iran’s nuclear program.
Because my research has led me to believe we’re risking World War 3 with Iran for a completely different reason.
Click here to find out what it is.Because it can be difficult for U.S. investors to buy individual Indian stocks, exchange-traded funds (ETFs) focused on India are often the simplest way to gain broad exposure to the market.
An Earnings-Weighted India Fund Focuses on Profitability
The WisdomTree India Earnings Fund (NYSEARCA: EPI) provides broad exposure to roughly 350 Indian stocks. What sets EPI apart is that it does not use a market-cap weighting; instead, it weights holdings by earnings. That approach can produce a portfolio that is more profit-focused than a market-cap-weighted index and gives investors access to smaller firms as well as large ones.
As a result, a handful of EPI’s several hundred positions each represent 5% or more of the portfolio; a broad basket can still be relatively concentrated in a small number of companies. The fund’s unique weighting and international focus mean its expense ratio is relatively high at 0.84%.
Still, for investors seeking coverage of India’s financials, energy, materials and industrials sectors, among others, EPI can be a strong choice. Its one‑year return is -4%, although it has risen roughly 4% in the past month.
Pure-Play Exposure Via a Small-Cap Strategy
In a growing economy, small-cap stocks may offer enhanced growth potential. The iShares MSCI India Small-Cap ETF (BATS: SMIN) targets this segment, holding hundreds of small-cap names across nearly all sectors to provide broad small‑cap exposure. Because the largest position in SMIN represents only about 1.7% of assets, the fund is less likely to be overweighted in a few companies compared with EPI or other India ETFs.
For a 0.74% expense ratio, SMIN also offers a dividend yield, which may appeal to investors looking to balance small‑cap volatility with some income. That volatility is visible in recent performance: SMIN is down nearly 4% over the past 12 months but has surged roughly 10% over the last month.
If a pure small‑cap focus is too narrow, SMIN is intended to complement iShares’ larger India fund, the iShares MSCI India ETF (BATS: INDA). INDA’s portfolio is smaller and more concentrated in major Indian companies such as Reliance Industries Ltd. and Infosys Ltd. (NYSE: INFY). With an expense ratio of 0.61%, INDA is among the least expensive India-focused ETFs available to U.S. investors.
An Alternative Approach: Equities Exposure With a Currency Hedge Overlay
Investors who want equity exposure to India but are wary of currency swings may consider the WisdomTree India Hedged Equity Fund (NASDAQ: INDH).
INDH’s portfolio is much narrower than EPI’s and is relatively concentrated among top holdings. The primary advantage is its currency‑hedging strategy, which aims to reduce the impact of fluctuations between the U.S. dollar and the Indian rupee.
INDH can be a more conservative way to access India equities while limiting currency risk, and its annual fee is modest at 0.64% — slightly above INDA’s expense ratio.
This email communication is a sponsored email sent on behalf of Paradigm Press, a third-party advertiser of The Early Bird and MarketBeat.
If you need assistance with your newsletter, feel free to email our South Dakota based support team at [email protected].
If you no longer wish to receive email from The Early Bird, you can unsubscribe.
© 2006-2026 MarketBeat Media, LLC.
345 North Reid Place, Suite 620, Sioux Falls, S.D. 57103. United States of America..