The #1 stock to buy BEFORE the June S-1 filing 
Casey's General Stores: Is a Stock Split on the Horizon?
Written by Thomas Hughes on April 27, 2026

Key Points
- Casey's General Stores is on track for a stock split with its shares topping $800 in Q2 2026.
- Split or not, investors win with Casey's self-funded growth and capital return.
- Capital return includes dividends, dividend growth, and share buybacks that reduce the share count.
- Special Report: The REAL Reason Trump is Invading Iran

Casey’s General Stores (NASDAQ: CASY) has made no official comment on stock splits, choosing instead to focus on its growth, financial health, cash flow, and capital returns. However, the case for a split is getting stronger by the quarter. Casey’s stock price has increased by 45% since the start of 2026 and 260% over the past five years, and is likely to continue rising. It is already in what many analysts consider the “split zone," with factors like cash flow and capital returns driving the market; it’s only a matter of time until a split will come.
Porter Stansberry flew the Porter and Co. team 3,300 miles to Dublin to investigate a 17-year investing experiment called Project Prophet - and documented everything on film.
Rooted in the laws of physics, this quantitative approach challenges conventional wealth-building wisdom. With 17 years of verified data behind it, Porter calls it unlike anything he has seen in nearly 30 years in the business. Watch the full investigation and decide for yourself Casey’s Stock Price Reaches Heady Levels: Higher Prices Will Come (Split or No Split)
There are many reasons a company might split its stock, and the primary one is accessibility. A high and rising share price, topping $500 and approaching $1000, is daunting for many investors and keeps many retail traders out of the market.
A stock split does nothing to the underlying business except increase the total number of shares; for investors, it makes each share less expensive, opening the door to increased trading volume, greater liquidity, and reduced volatility. Corporations may target their employees specifically, but the lower price benefits all. Additionally, stock splits can signal managerial confidence in future results, the underlying factor in this speculation.
Casey’s chart price action provides no reason to believe the share price will fall significantly anytime soon, only indicating that its uptrend is vibrant and likely to continue higher. The monthly candles reveal robust action since 2026’s start, with a bullish Three White Soldiers formation turning into four, the market accelerating as Q2 began, volume conspicuously strengthening, and MACD momentum increasing.
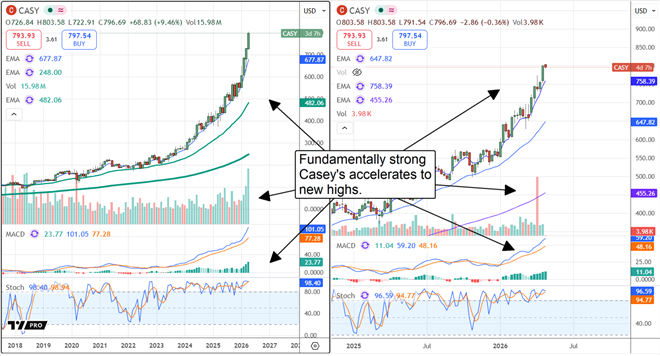
The chart indicators suggest Casey’s market has gotten stronger and underpin the outlook for bullish trading to continue. The shorter-term weekly chart concurs with the longer-term monthly chart, revealing a strong market amid accelerating conditions. While Casey’s stock split is questionable, investors will win either way with its rising stock price.
What drives Casey’s chart price action is its fundamental health, self-funded growth, and capacity to return capital to investors. The company paused share buybacks in 2025 to conserve cash for an acquisition. The story in 2026 is that the acquisition closed, integration is very smooth, growth accelerated, and the long-term outlook was improved.
Now, Casey’s is back into buying mode, with the fiscal Q3 2026 activity reducing the share count sequentially and YOY, and expected to continue in the upcoming quarters. The only risk is that buybacks are paused again to prep for acquisitions that, to date, have provided investors with significant value.
Capital Returns Drive Value for Casey’s Investors
Dividends are also significant and unlikely to be adversely affected by future acquisitions. As it stands, the dividend yield isn’t that much, about 0.3% with shares near $800, but it is safe, reliable, and growing. The company has grown its dividend for nearly 25 years, putting it on track to be included in the Dividend Aristocrat Index. Casey’s stock was added to the S&P 500 in early 2026, a factor that affected the stock price and volatility. Index inclusion means accumulation for indexing funds and money managers; the S&P 500 and Dividend Aristocrats are among the most heavily followed indices and benchmarks available.
Casey’s Q3-end balance sheet highlights no red flags, only signs of strength and the capacity to continue executing its strategy. The company’s cash was up, assets were up, liabilities were flat, and its existing debt is primarily finance-lease obligations. Total leverage is low, with total assets nearly double liabilities, long-term debt a little over 0.5X equity, and equity rising. Equity increased by nearly 10% year-to-date and is likely to continue increasing as the years progress.
A physicist in Dublin claims his AI algorithm has beaten the market for 17 consecutive years - with nearly 2,000% total returns and only one losing year across two decades of crises.
Porter Stansberry flew to Ireland to investigate the claim firsthand. The result is a new investigative documentary called 'Investigating Project Prophet,' available to stream now at no cost. Stream 'Investigating Project Prophet' free and see what they found Analysts Lead Institutions: Point to Higher Prices in 2026
Sell-side data reveals that the leading and lagging indicators are aligned with Casey’s uptrend. The leading indicator is the analysts, which trend includes increasing coverage, firming sentiment, and an uptrend in the price target.
Fifteen analysts tracked by MarketBeat provide a reasonable conviction in the Moderate Buy rating and have a bullish bias, with nine rating it Buy.
The consensus price target lags the price action as of late May, but the trend is moving higher, topping out above $850. That’s worth another 6% upside relative to late-April trading levels; higher targets are likely to be set.
Institutions, the lagging indicators, are following the analysts’ advice. The data reveals them buying for seven consecutive quarters, running a $2-to-$1 trailing 12-month balance, and activity ramping into mid-year 2026. The Q1 activity set a multi-year high; the Q2 activity is less robust but still reveals accumulation at a solid clip.
Read this article online ›
Read More

Did you like this article?
 
|