There's a strong argument to be made that Blue Owl’s 65% drop has been completely overcooked, and analysts are calling for as much as 150%... ͏ ͏ ͏ ͏ ͏ ͏ ͏ ͏ ͏ ͏ ͏ ͏ ͏ ͏ ͏ ͏ ͏ ͏ ͏ ͏ ͏ ͏ ͏ ͏ ͏ ͏ ͏ ͏ ͏ ͏ ͏ ͏ ͏ ͏ ͏ ͏ ͏ ͏ ͏ ͏ ͏ ͏ ͏ ͏ ͏ ͏ ͏ ͏ ͏ ͏ ͏ ͏ ͏ ͏ ͏ ͏ ͏ ͏ ͏ ͏ ͏ ͏ ͏ ͏ ͏ ͏ ͏ ͏ ͏ ͏ ͏ ͏ ͏ ͏ ͏ ͏ ͏ ͏ ͏ ͏ ͏ ͏ ͏ ͏ ͏ ͏ ͏ ͏ ͏ ͏ ͏ ͏ ͏ ͏ ͏ ͏ ͏ ͏ ͏ ͏ |
| | Written by Sam Quirke 
Blue Owl Capital Inc. (NYSE: OWL), an alternative investment asset management group, has been making headlines for all the wrong reasons lately.
Shares are currently trading around $9, down more than 65% from their highs last year and over 40% since the start of this year alone. It’s not exactly a high-growth tech stock, though its recent price action would suggest otherwise.
For a company in the private credit space, where it specialises in loans to the software industry, that kind of collapse raises some worrying questions, and, as we’ll see below, investor fears have been justified. They’re right to ask whether something is fundamentally broken, but at the same time, a growing group of voices is calling it a screaming buy opportunity.
Let’s take a closer look at what's going on and how real this opportunity might be.
What Spooked Investors
To set the scene, the multi-month selloff in Blue Owl shares has largely been driven by a combination of weakening sentiment in the private credit space and the selloff in traditional software stocks, which make up the bulk of Blue Owl’s creditors. As we’ve been highlighting recently, software stocks have been under immense pressure to prove they can avoid being completely disrupted by the AI revolution.
Many of them have had to watch as stock price growth trajectories flatlined, causing shares to collapse to multi-year lows. As a major lender to these types of companies, Blue Owl is particularly exposed to any of its creditors getting into financial difficulties.
With investors’ appetite for risk souring even more with the conflict in the Middle East, they’ve become particularly wary of any cracks in the credit markets. If defaults were to rise or liquidity were to tighten, firms like Blue Owl would face pressure on both asset values and fundraising. Add in growing concerns that the company might be looking to restrict investors from withdrawing their money, and you can see why the stock has been dumped en masse.
The Fundamentals Are Stable
However, there is a growing argument that the market may have overreacted, given Blue Owl’s core business remains relatively stable. Its fee-based model, built on long-duration capital, provides a level of earnings visibility that many other financial firms lack. Unlike more transactional businesses, a significant portion of its revenue is not dependent on short-term market activity.
The dividend is another reason to be bullish. It has a four-year track record of increases, and, at current levels, carries a yield of around 10%. For income-focused investors, that alone makes the stock hard to ignore.
Analysts Are Turning Bullish
Perhaps the most telling shift in recent weeks has been the change in analyst sentiment. Having endured several downgrades in the early weeks of the year, Blue Owl is now collecting bullish ratings from the likes of BMO Capital Markets and TD Cowen, who both reiterated Buy-equivalent ratings this week. They echoed similar bullish calls from Oppenheimer earlier this month, and the messaging is consistent: market fears about private credit and AUM growth appear overblown relative to the company’s actual performance.
The refreshed price targets reinforce that view, with some, like Citizens Jmp’s $23, calling for more than 150% upside from current levels. That kind of disconnect between price and expectation is not only rare, but it also suggests the risk/reward profile has become heavily skewed towards the bulls.
Sizing up the Opportunity
At the same time, however, Blue Owl still trades with a price-to-earnings ratio above 80, which is not only elevated by most standards but also far higher than most of its peers.
That creates a risk in and of itself heading into next month’s earnings report. While on the one hand, expectations are already close to rock bottom, with its P/E ratio still on the frothy side, there could be a lot of further downside if the company fails to impress. In other words, while the chart alone might make the stock look cheap relative to where it was, it’s not necessarily cheap in absolute terms.
However, if Blue Owl can show signs of steady AUM growth, reaffirm dividend stability, and prove the bears wrong, the reaction could be impressive. In a stock that has already fallen this far, it wouldn’t take much to trigger a rapid reversal, especially when you have recent analyst updates calling for 150% in upside.  Read This Story Online Read This Story Online |  |
| Written by Thomas Hughes 
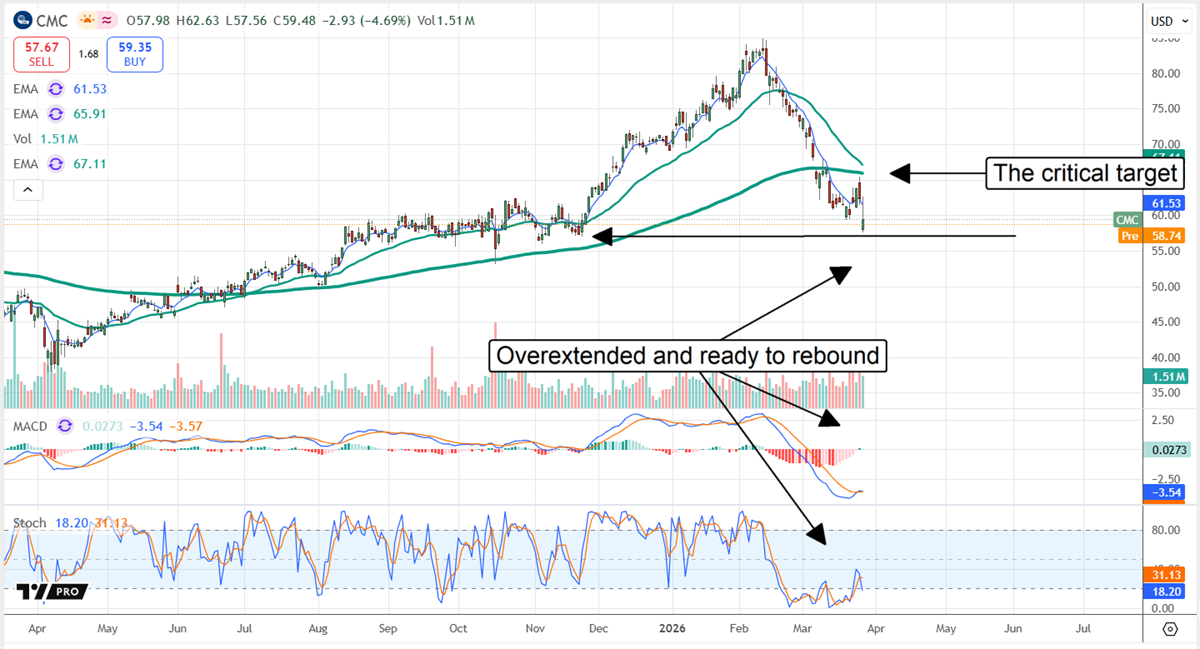
Commercial Metals' (NYSE: CMC) stock price is down at the end of Q1 2026 amid macroeconomic concerns and potential disruption not reflected in its results. The move has the market overextended near a six-month low, poised to snap back and potentially with vigor. The technical setup suggests market dynamics have already shifted, and a sustainable rebound and uptrend are ready to form. CMC’s stock price could quickly reclaim its critical support targetand then continue advancing as the year progresses.
The critical support target is $65. This level aligns with a long-term exponential moving average broken in early March as geopolitical tensions mounted.
It reflects long-term, buy-and-hold market sentiment, including institutional holders, which are accumulating stock in 2026. MarketBeat’s data shows this group owns a solid 87% of the materials company and provides a strong support base, with 11 consecutive quarters of accumulation.
While institutional selling ramped in Q1 2026, a larger increase in buying offset it, resulting in a multiyear high. The takeaway is that institutions repositioned in Q1 but remain bullish on this stock. The likely outcome is that they continue to buy, given the low price point in late March and early April, which will underpin the stock price rally forecast for this year.
Short-sellers are also in the mix, having ramped their activity in 2025 and into Q1 2026, but present less of a hurdle and more of an opportunity. At nearly 4%, short interest is not prohibitively high and provides fuel for a rally driven by short-covering. The question is what might lead the shorts to cover their positions, and growth, wider margins, and higher capital returns may be the ticket.
Commercial Metals Grows, Widens Margins, Increases Capital Returns
Commercial Metals Company had a virtually stainless fiscal Q2 2026 with revenue growing by 21.7% to nearly $2.15 billion. The top-line exceeded analyst consensus by 290 basis points, driven by volume and pricing. Steel shipment volumes were relatively flat in North America and Europe, with favorable pricing conditions leading to top-line growth and margin strength. The Construction Solutions Group (CSG) was the strongest, growing by 98%, driven by demand, pricing, and acquisitions. Acquisitions center on a precast concrete platform, a pillar of the company’s growth strategy.
The news was not entirely good; however, the 14-cent miss in adjusted earnings isn’t as bad as it appears, given the 31-cent year-over-year (YOY) increase and 114% increase in core EBITDA. EBITDA margin improved by 610 basis points on execution, momentum, favorable conditions, and acquisitions. Any weakness relative to the consensus can be attributed to acquisitions, which are ultimately one-time events that improve revenue and margins.
Guidance is among the reasons why CMC stock will likely rebound in its fiscal Q3. The company expects EBITDA to improve meaningfully over the second quarter, underpinned by strength in CSG. CSG EBITDA is expected to nearly double, and the forecast may be cautious. Early signs suggest a solid spring and summer construction season, with backlog growing and additional efficiencies expected.
Signs of managerial confidence in the outlook lie in the capital return. The company increased its dividend payments by more than 10% annually, while also compounding them through share buybacks. The dividend yield is approximately 1.2%, while buybacks have reduced the share count by 1.4% fiscal-year-to-date.
Analysts Trends Support CMC Stock: Add Upward Price Pressure to Market
Initial responses by analysts to CMC’s update were not robust, but they reaffirmed the bullish trends in place. The few reaffirmed price targets carry a Moderate Buy rating and a 22.5% upside forecast. Assuming the company continues to execute well, the trends will likely continue and potentially strengthen as the year progresses. As it stands, the consensus $73 puts this market well above its critical support target, while the high end highlights an opportunity for fresh all-time highs.
Commercial Metals has several catalysts in play that may help drive the action later this year. Not only are tariffs and pricing favorable to the business, but its Transform, Advance, Grow strategy aims to deliver $150 million in annualized cost savings by year-end.
Additionally, a new West Virginia mill is expected to drive revenue and margins through technological advancements, while the integration of the precast platform will also improve results. Risks include market volatility, geopolitical tensions, and execution. Read This Story Online |  Musk just launched another batch. Bezos secured approval for 50,000 more satellites. Right now, over 15,000 are circling the planet - and that number could triple by next year.
The official story is global internet coverage. But a new presentation argues the real implications reach far beyond connectivity - and could change how the market works. Watch the presentation and see what the satellite race really means |
| Written by Chris Markoch 
It’s helpful to remember that many of today’s top mega-cap companies started as speculative small-cap stocks. But no matter the size of the company, the best stocks are the ones that continue to grow revenue and earnings.
Investors do have to deal with more volatility with small-cap stocks. Even small price moves in these stocks can lead to outsized results. That’s because, in many cases, these are companies that are not profitable, and some may be generating little to no revenue. In many cases, these names use debt to grow their businesses.
That wasn’t a problem when the Federal Reserve kept interest rates near zero percent. The cost of capital was cheap, and the risks were negligible. However, the cost of capital has increased with higher interest rates, and the latest remarks from Fed chair Jerome Powell implied that the agency is in no hurry to cut rates this year.
It’s no wonder then that the Russell 2000 index, commonly referred to as the “small-cap” index, is down slightly this year. However, the index has had a solid three-year run despite an environment of higher interest rates.
Yet the valuation gap between the Russell 2000 and the S&P 500 remains wide. As of March 26, the average price-to-earnings ratio of the Russell was around 19x earnings as opposed to 27x for the S&P 500. That means the Russell 2000 valuation would have to increase by approximately 50% to match that of the S&P 500.
That's why some analysts believe now is the time to get positioned in Russell 2000 stocks. If the market rips higher on there is any hint of lower interest rates, these stocks are likely to catch the interest of investors.
IWM ETF Offers Broad Exposure to Russell 2000 Opportunities
Exchange-traded funds (ETFs) aren’t built to beat the market, but they have a place in most portfolios. One choice for investors who want to take a position in small-cap stocks without single stock risk is the iShares Russell 2000 ETF (NYSEARCA: IWM).
As its name implies, this fund is designed to help investors “own the index,” similar to how the SPDR S&P 500 ETF Trust (NYSEARCA: SPY) allows investors to get performance that’s in line with that of the S&P 500.
Investors may find the composition of the IWM fund interesting. The top four sectors in terms of weighted exposure as a percentage are financials, health care, industrials, and consumer discretionary, each with over 10% of the fund’s exposure. That contrasts with the SPY, which has over 31% of its sector exposure in technology.
That could be a signal of where analysts and institutions believe the growth will come from in the coming years. Speaking of institutions, the ratio of institutional buying to selling for this ETF is about 4:1 in the last 12 months. That’s a signal that retail investors will want to watch.
Mueller Water Products Taps Into Infrastructure Spending Trends
Looking at the sector exposure of the IWM fund can help you find individual companies within the Russell 2000 that may be poised for strong gains. One of those names is Mueller Water Products (NYSE: MWA). With a market cap of around $4.3 billion on March 26, it’s not a small-cap, but it is still small enough for inclusion in the Russell 2000.
Mueller is one of the largest and most critical names in the water infrastructure industry. It has one of the largest installed bases of iron gate valves and fire hydrants in the United States.
The company has posted solid year-over-year revenue and earnings growth that’s expected to continue. A key reason for that expectation is the federal government’s investment in rebuilding the nation’s aging water infrastructure. The majority of Mueller’s manufacturing base is in the United States, which makes it an obvious choice for an administration that is looking to keep manufacturing onshore.
That has an additional benefit of limiting Mueller’s exposure to imported foreign materials that come with tariff risks.
MWA stock is up more than 16% in 2026, and the analyst forecasts on MarketBeat reveal a consensus price target that suggests more than 10% upside. Plus, with a price-to-earnings ratio around 22, it trades at a slight discount to other industrial stocks.
AAON Stock Gains Momentum From Data Center Demand
AAON Inc. (NASDAQ: AAON) is another mid-cap name that is small enough for inclusion in the Russell 2000. AAON manufactures specialized heating and cooling (HVAC) systems for commercial and industrial applications.
In 2026, that includes data centers. In the company’s Q4 2025 earnings report, AAON cited a backlog valued at $1.3 billion. That supports the company’s guidance for sales growth between 18% and 20% and gross margins between 29% and 31%. This is another made-in-the-USA story, since the company generates most of its revenue in the United States.
AAON stock has been prone to wide swings in the last 12 months, with over 20 moves of at least 5%. Still, analysts remain bullish with a price target of $107.75, which would be a gain of about 30% from the AAON stock price in late March. Read This Story Online |  A $2 gold stock is said to quietly control what may be the largest gold deposit in the world - worth nearly $1 trillion.
According to Jim Rickards, an announcement is expected around April 15 that could bring this historic discovery into public view. See the full details on this $2 gold stock before April 15 |
| More Stories |
| |
|
|