Email
WARN ACT + Unemployment Data Update: March through July 11, 2020
| From | Center for Jobs and the Economy <[email protected]> |
| Subject | WARN ACT + Unemployment Data Update: March through July 11, 2020 |
| Date | July 16, 2020 9:30 PM |
Links have been removed from this email. Learn more in the FAQ.
Links have been removed from this email. Learn more in the FAQ.
Web Version [link removed] | Update Preferences [link removed] [link removed] WARN ACT + Unemployment Data Update: March through July 11, 2020
Even prior to the current round of new closures, total California initial claims (regular UI plus PUA claims by the self-employed) continued rising for the week of July 11 by 13.4%. The increase coming from the regular UI was below the number of new PUA claims by the self-employed, reflecting the additional destructive element coming from last year’s AB 5 in the current unemployment crisis.
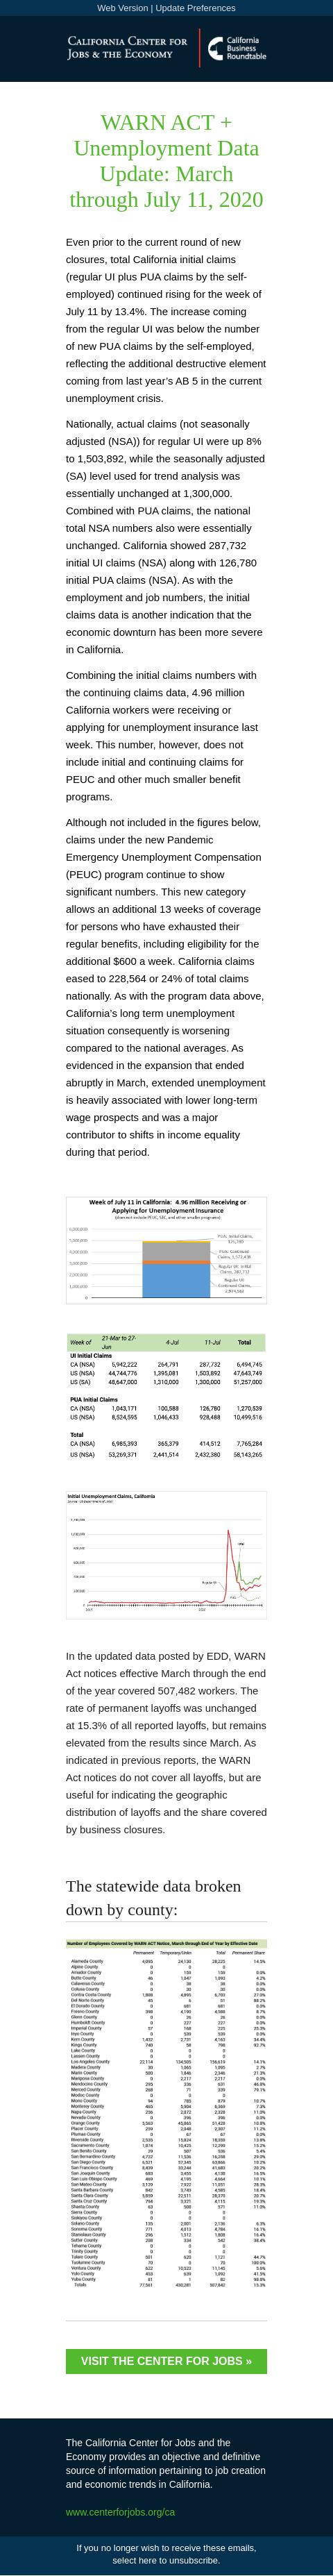
Nationally, actual claims (not seasonally adjusted (NSA)) for regular UI were up 8% to 1,503,892, while the seasonally adjusted (SA) level used for trend analysis was essentially unchanged at 1,300,000. Combined with PUA claims, the national total NSA numbers also were essentially unchanged. California showed 287,732 initial UI claims (NSA) along with 126,780 initial PUA claims (NSA). As with the employment and job numbers, the initial claims data is another indication that the economic downturn has been more severe in California.
Combining the initial claims numbers with the continuing claims data, 4.96 million California workers were receiving or applying for unemployment insurance last week. This number, however, does not include initial and continuing claims for PEUC and other much smaller benefit programs.
Although not included in the figures below, claims under the new Pandemic Emergency Unemployment Compensation (PEUC) program continue to show significant numbers. This new category allows an additional 13 weeks of coverage for persons who have exhausted their regular benefits, including eligibility for the additional $600 a week. California claims eased to 228,564 or 24% of total claims nationally. As with the program data above, California’s long term unemployment situation consequently is worsening compared to the national averages. As evidenced in the expansion that ended abruptly in March, extended unemployment is heavily associated with lower long-term wage prospects and was a major contributor to shifts in income equality during that period.
In the updated data posted by EDD, WARN Act notices effective March through the end of the year covered 507,482 workers. The rate of permanent layoffs was unchanged at 15.3% of all reported layoffs, but remains elevated from the results since March. As indicated in previous reports, the WARN Act notices do not cover all layoffs, but are useful for indicating the geographic distribution of layoffs and the share covered by business closures.
The statewide data broken down by county: Visit The Center For Jobs » [[link removed]] The California Center for Jobs and the Economy provides an objective and definitive source of information pertaining to job creation and economic trends in California. [[link removed]] Contact 1301 I Street Sacramento, CA 95814 916.553.4093 If you no longer wish to receive these emails, select here to unsubscribe. [link removed]
Even prior to the current round of new closures, total California initial claims (regular UI plus PUA claims by the self-employed) continued rising for the week of July 11 by 13.4%. The increase coming from the regular UI was below the number of new PUA claims by the self-employed, reflecting the additional destructive element coming from last year’s AB 5 in the current unemployment crisis.
Nationally, actual claims (not seasonally adjusted (NSA)) for regular UI were up 8% to 1,503,892, while the seasonally adjusted (SA) level used for trend analysis was essentially unchanged at 1,300,000. Combined with PUA claims, the national total NSA numbers also were essentially unchanged. California showed 287,732 initial UI claims (NSA) along with 126,780 initial PUA claims (NSA). As with the employment and job numbers, the initial claims data is another indication that the economic downturn has been more severe in California.
Combining the initial claims numbers with the continuing claims data, 4.96 million California workers were receiving or applying for unemployment insurance last week. This number, however, does not include initial and continuing claims for PEUC and other much smaller benefit programs.
Although not included in the figures below, claims under the new Pandemic Emergency Unemployment Compensation (PEUC) program continue to show significant numbers. This new category allows an additional 13 weeks of coverage for persons who have exhausted their regular benefits, including eligibility for the additional $600 a week. California claims eased to 228,564 or 24% of total claims nationally. As with the program data above, California’s long term unemployment situation consequently is worsening compared to the national averages. As evidenced in the expansion that ended abruptly in March, extended unemployment is heavily associated with lower long-term wage prospects and was a major contributor to shifts in income equality during that period.
In the updated data posted by EDD, WARN Act notices effective March through the end of the year covered 507,482 workers. The rate of permanent layoffs was unchanged at 15.3% of all reported layoffs, but remains elevated from the results since March. As indicated in previous reports, the WARN Act notices do not cover all layoffs, but are useful for indicating the geographic distribution of layoffs and the share covered by business closures.
The statewide data broken down by county: Visit The Center For Jobs » [[link removed]] The California Center for Jobs and the Economy provides an objective and definitive source of information pertaining to job creation and economic trends in California. [[link removed]] Contact 1301 I Street Sacramento, CA 95814 916.553.4093 If you no longer wish to receive these emails, select here to unsubscribe. [link removed]
Message Analysis
- Sender: California Center for Jobs and the Economy
- Political Party: n/a
- Country: United States
- State/Locality: California
- Office: n/a
-
Email Providers:
- Campaign Monitor