| From | Center for Jobs and the Economy <[email protected]> |
| Subject | California Trade Report for May 2020 |
| Date | July 6, 2020 5:30 PM |
Links have been removed from this email. Learn more in the FAQ.
Links have been removed from this email. Learn more in the FAQ.
Web Version [link removed] | Update Preferences [link removed] [link removed] California Trade Report
for May 2020
Below are highlights from the recently released trade data from the US Census Bureau and US Bureau of Economic Analysis. To view additional data and analysis related to the California economy visit our website at [[link removed]].
The May data shows deeper effects stemming from the global supply disruptions that began with the closures in China. As shown in the table below, goods trade with China, Hong Kong, and Macau through the state’s ports was down 10.8% from the year earlier, a marked improvement from the March slide of 34.0% but showing erosion from the April numbers. May exports to this area were little changed from April, but imports were down substantially—an indication of lowered consumer spending along with continued global supply chain disruptions as Chinese production struggles to revive first in the face of the previous closures and second as they deal with a continuing wave of canceled orders.
Share of Goods through US Ports 17.4% CA Share of Total Trade Through US Ports
The share of total US goods trade (exports and imports) through California ports rose to 17.43% (12 month moving average; compared to 17.35% in Apr 2020 and 17.97% in May 2019).
California remained the #2 state, behind Texas with 17.51% (compared to 17.8% in Apr 2020 and 17.69% in May 2019). Trade through the Atlantic port states was at 30.23% (compared to 30.02% in Apr 2020 and 29.54% in May 2019). The state’s continued strength in this area forms the trade-related base for one of California’s largest centers of middle-class, blue-collar jobs. Transportation & Warehousing alone provided 596,000 jobs in May (down from 629,100 in May 2019), paying an average annual salary of $62.0k. This employment base in turn supports additional blue-collar and white-collar jobs in a range of other industries.
California Goods Exports Decrease -$4.9 Billions in Exports
Total California goods exports dropped $4.9 billion from May 2019 (down 32%). California remained in 2nd place with 10.56% of all US goods exports (12 month moving total), behind Texas at 20.26%.
California's Balance for Goods Trade -$16.7 Billion of Goods Trade
California’s balance of goods trade activity through state businesses narrowed to -$16.7 billion, compared to a level of -$20.6 billion in May 2019. California trade accounted for 23% of the US trade deficit in goods in May 2020.
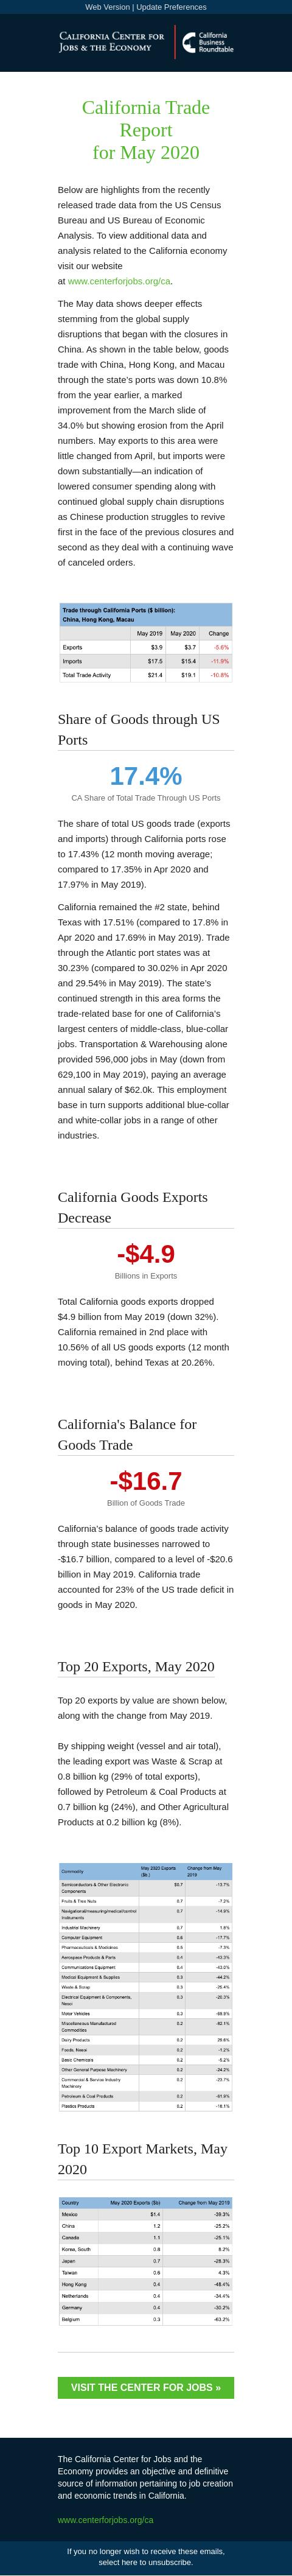
Top 20 Exports, May 2020
Top 20 exports by value are shown below, along with the change from May 2019.
By shipping weight (vessel and air total), the leading export was Waste & Scrap at 0.8 billion kg (29% of total exports), followed by Petroleum & Coal Products at 0.7 billion kg (24%), and Other Agricultural Products at 0.2 billion kg (8%).
Top 10 Export Markets, May 2020 Visit the center for jobs » [[link removed]] The California Center for Jobs and the Economy provides an objective and definitive source of information pertaining to job creation and economic trends in California. [[link removed]] Contact 1301 I Street Sacramento, CA 95814 916.553.4093 If you no longer wish to receive these emails, select here to unsubscribe. [link removed]
for May 2020
Below are highlights from the recently released trade data from the US Census Bureau and US Bureau of Economic Analysis. To view additional data and analysis related to the California economy visit our website at [[link removed]].
The May data shows deeper effects stemming from the global supply disruptions that began with the closures in China. As shown in the table below, goods trade with China, Hong Kong, and Macau through the state’s ports was down 10.8% from the year earlier, a marked improvement from the March slide of 34.0% but showing erosion from the April numbers. May exports to this area were little changed from April, but imports were down substantially—an indication of lowered consumer spending along with continued global supply chain disruptions as Chinese production struggles to revive first in the face of the previous closures and second as they deal with a continuing wave of canceled orders.
Share of Goods through US Ports 17.4% CA Share of Total Trade Through US Ports
The share of total US goods trade (exports and imports) through California ports rose to 17.43% (12 month moving average; compared to 17.35% in Apr 2020 and 17.97% in May 2019).
California remained the #2 state, behind Texas with 17.51% (compared to 17.8% in Apr 2020 and 17.69% in May 2019). Trade through the Atlantic port states was at 30.23% (compared to 30.02% in Apr 2020 and 29.54% in May 2019). The state’s continued strength in this area forms the trade-related base for one of California’s largest centers of middle-class, blue-collar jobs. Transportation & Warehousing alone provided 596,000 jobs in May (down from 629,100 in May 2019), paying an average annual salary of $62.0k. This employment base in turn supports additional blue-collar and white-collar jobs in a range of other industries.
California Goods Exports Decrease -$4.9 Billions in Exports
Total California goods exports dropped $4.9 billion from May 2019 (down 32%). California remained in 2nd place with 10.56% of all US goods exports (12 month moving total), behind Texas at 20.26%.
California's Balance for Goods Trade -$16.7 Billion of Goods Trade
California’s balance of goods trade activity through state businesses narrowed to -$16.7 billion, compared to a level of -$20.6 billion in May 2019. California trade accounted for 23% of the US trade deficit in goods in May 2020.
Top 20 Exports, May 2020
Top 20 exports by value are shown below, along with the change from May 2019.
By shipping weight (vessel and air total), the leading export was Waste & Scrap at 0.8 billion kg (29% of total exports), followed by Petroleum & Coal Products at 0.7 billion kg (24%), and Other Agricultural Products at 0.2 billion kg (8%).
Top 10 Export Markets, May 2020 Visit the center for jobs » [[link removed]] The California Center for Jobs and the Economy provides an objective and definitive source of information pertaining to job creation and economic trends in California. [[link removed]] Contact 1301 I Street Sacramento, CA 95814 916.553.4093 If you no longer wish to receive these emails, select here to unsubscribe. [link removed]
Message Analysis
- Sender: California Center for Jobs and the Economy
- Political Party: n/a
- Country: United States
- State/Locality: California
- Office: n/a
-
Email Providers:
- Campaign Monitor