Looking at the numbers behind this year’s state legislative candidates
We are excited to release the 10th volume of our annual state legislative competitiveness study later this year. With 35 state filing deadlines that have passed and for which we have full data, here’s an interim update from the data.
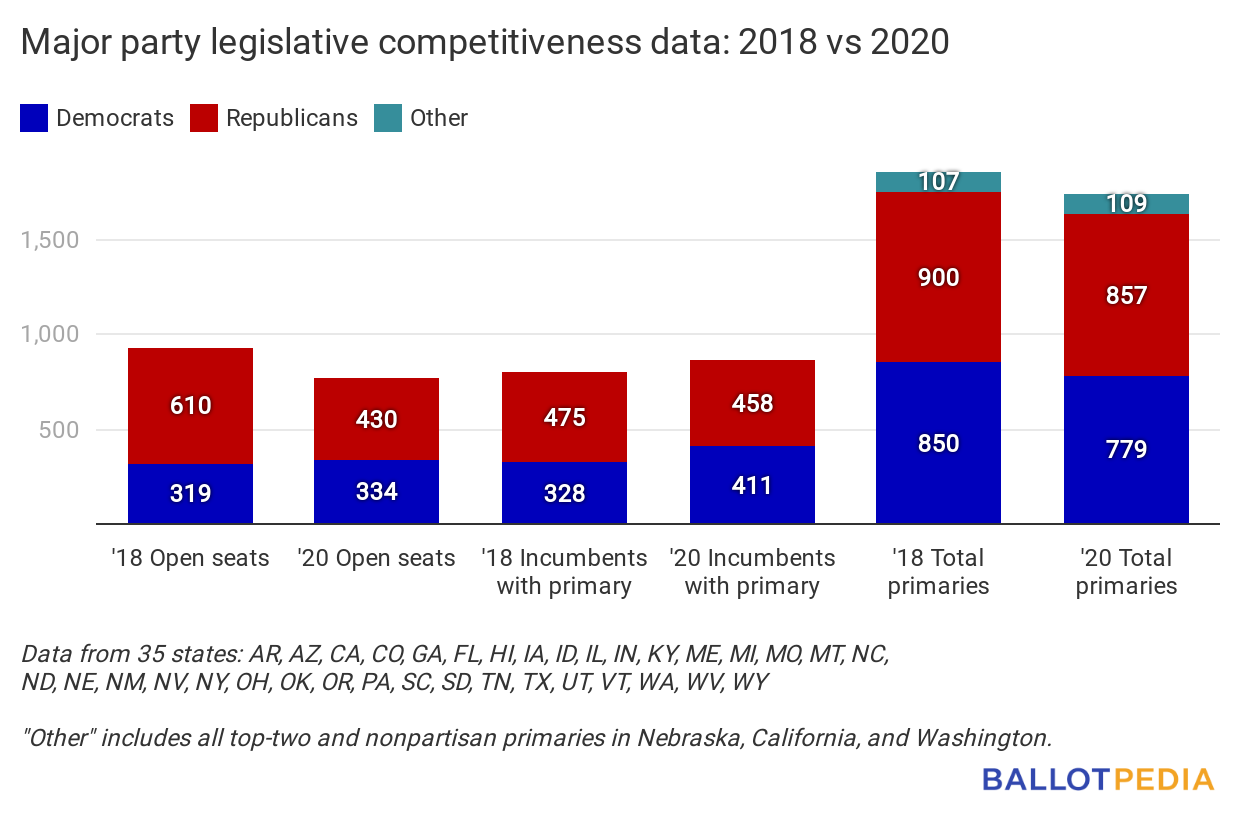
So far this year, more incumbents have primary challenges, there are fewer open seats than in 2018, and fewer contested state legislative primaries than in 2018.
Looking at the 35 states whose filing deadlines have passed gives us an apples-to-apples comparison of 2020 to 2018 data. Here’s what that looks like so far.
This year, 5,100 state legislative seats are up for regular election in the 35 states, compared to 4,833 in 2018. 10,813 major party candidates—5,414 Democrats and 5,399 Republicans—are running in these states, compared to 11,004—5,737 Democrats and 5,267 Republicans—in 2018.

Open seats
Fewer incumbents are retiring in 2020 compared to 2018. This year, 764 major party incumbents (15% of seats up for election) are not running for re-election. In 2018, 929 major party incumbents (19%) did not run for re-election.
Incumbents with primary challenges
More incumbents have primary challenges this year than in 2018. This year, 869 incumbents have at least one primary challenger, with the addition of one independent who ran in a top-two California primary. In 2018, 803 incumbents had at least one challenger, in addition to a Libertarian incumbent who ran in a nonpartisan primary in Nebraska. In 2018, 86% of incumbents in these states won their primaries.
Total primaries
There are fewer contested primaries this year—1,755—versus 2018, when there were 1,857. These totals include all competitive top-two and nonpartisan primaries. On Nov. 3, 1,164 state senate seats and 4,711 state house seats are up for regular election. There is a Republican majority in 52 chambers, a Democratic majority in 33, and a power-sharing agreement in the Alaska House.
|