| From | Center for Jobs and the Economy <[email protected]> |
| Subject | California Trade Report for May 2025 |
| Date | July 7, 2025 6:59 PM |
Links have been removed from this email. Learn more in the FAQ.
Links have been removed from this email. Learn more in the FAQ.
Web Version [link removed] | Update Preferences [link removed] [link removed] California Trade Report
for May 2025
Below are highlights from the recently released trade data from the US Census Bureau and US Bureau of Economic Analysis. To view additional data and analysis related to the California economy visit our website at [[link removed]].
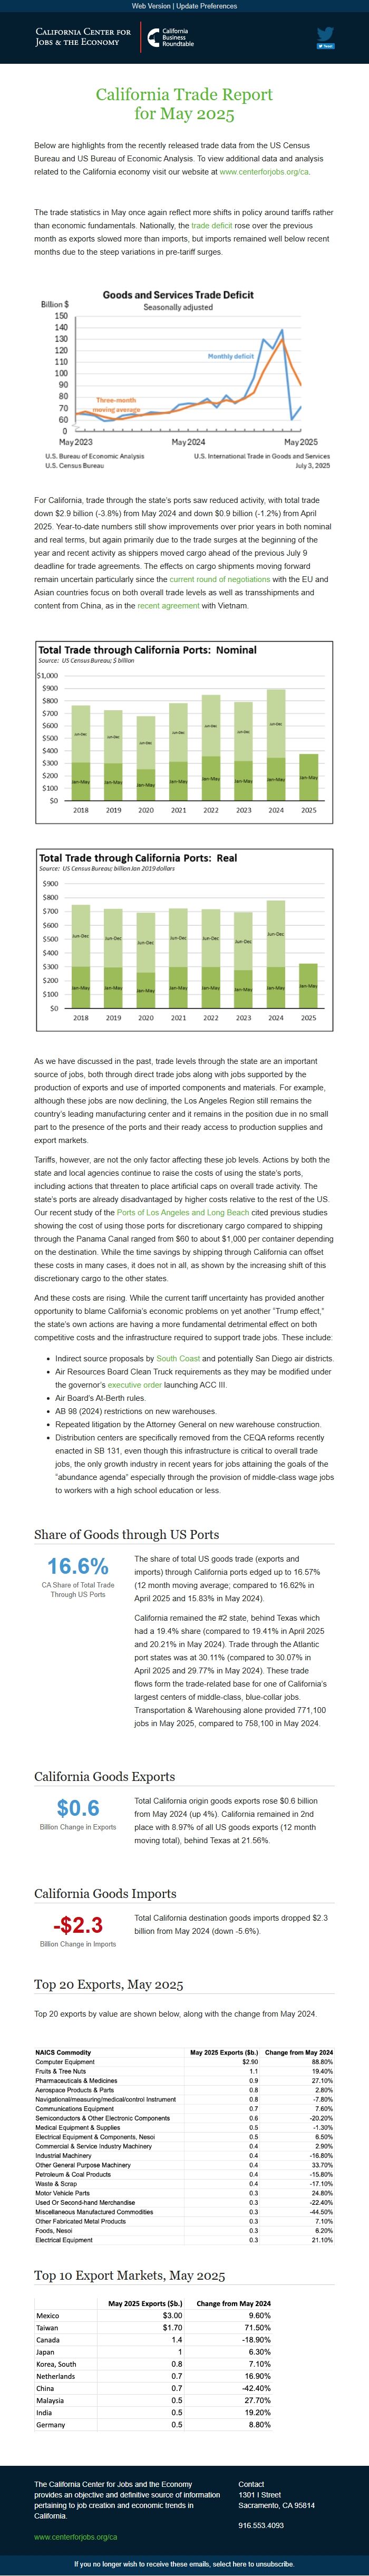
The trade statistics in May once again reflect more shifts in policy around tariffs rather than economic fundamentals. Nationally, the trade deficit [[link removed]] rose over the previous month as exports slowed more than imports, but imports remained well below recent months due to the steep variations in pre-tariff surges.
For California, trade through the state’s ports saw reduced activity, with total trade down $2.9 billion (-3.8%) from May 2024 and down $0.9 billion (-1.2%) from April 2025. Year-to-date numbers still show improvements over prior years in both nominal and real terms, but again primarily due to the trade surges at the beginning of the year and recent activity as shippers moved cargo ahead of the previous July 9 deadline for trade agreements. The effects on cargo shipments moving forward remain uncertain particularly since the current round of negotiations [[link removed]] with the EU and Asian countries focus on both overall trade levels as well as transshipments and content from China, as in the recent agreement [[link removed]] with Vietnam.
As we have discussed in the past, trade levels through the state are an important source of jobs, both through direct trade jobs along with jobs supported by the production of exports and use of imported components and materials. For example, although these jobs are now declining, the Los Angeles Region still remains the country’s leading manufacturing center and it remains in the position due in no small part to the presence of the ports and their ready access to production supplies and export markets.
Tariffs, however, are not the only factor affecting these job levels. Actions by both the state and local agencies continue to raise the costs of using the state’s ports, including actions that threaten to place artificial caps on overall trade activity. The state’s ports are already disadvantaged by higher costs relative to the rest of the US. Our recent study of the Ports of Los Angeles and Long Beach [[link removed]] cited previous studies showing the cost of using those ports for discretionary cargo compared to shipping through the Panama Canal ranged from $60 to about $1,000 per container depending on the destination. While the time savings by shipping through California can offset these costs in many cases, it does not in all, as shown by the increasing shift of this discretionary cargo to the other states.
And these costs are rising. While the current tariff uncertainty has provided another opportunity to blame California’s economic problems on yet another “Trump effect,” the state’s own actions are having a more fundamental detrimental effect on both competitive costs and the infrastructure required to support trade jobs. These include:
Indirect source proposals by South Coast [[link removed]] and potentially San Diego air districts. Air Resources Board Clean Truck requirements as they may be modified under the governor’s executive order [[link removed]] launching ACC III. Air Board’s At-Berth rules. AB 98 (2024) restrictions on new warehouses. Repeated litigation by the Attorney General on new warehouse construction. Distribution centers are specifically removed from the CEQA reforms recently enacted in SB 131, even though this infrastructure is critical to overall trade jobs, the only growth industry in recent years for jobs attaining the goals of the “abundance agenda” especially through the provision of middle-class wage jobs to workers with a high school education or less. Share of Goods through US Ports 16.6% CA Share of Total Trade Through US Ports
The share of total US goods trade (exports and imports) through California ports edged up to 16.57% (12 month moving average; compared to 16.62% in April 2025 and 15.83% in May 2024).
California remained the #2 state, behind Texas which had a 19.4% share (compared to 19.41% in April 2025 and 20.21% in May 2024). Trade through the Atlantic port states was at 30.11% (compared to 30.07% in April 2025 and 29.77% in May 2024). These trade flows form the trade-related base for one of California’s largest centers of middle-class, blue-collar jobs. Transportation & Warehousing alone provided 771,100 jobs in May 2025, compared to 758,100 in May 2024.
California Goods Exports $0.6 Billion Change in Exports
Total California origin goods exports rose $0.6 billion from May 2024 (up 4%). California remained in 2nd place with 8.97% of all US goods exports (12 month moving total), behind Texas at 21.56%.
California Goods Imports -$2.3 Billion Change in Imports
Total California destination goods imports dropped $2.3 billion from May 2024 (down -5.6%).
Top 20 Exports, May 2025
Top 20 exports by value are shown below, along with the change from May 2024.
Top 10 Export Markets, May 2025 The California Center for Jobs and the Economy provides an objective and definitive source of information pertaining to job creation and economic trends in California. [[link removed]] Contact 1301 I Street Sacramento, CA 95814 916.553.4093 If you no longer wish to receive these emails, select here to unsubscribe. [link removed]
for May 2025
Below are highlights from the recently released trade data from the US Census Bureau and US Bureau of Economic Analysis. To view additional data and analysis related to the California economy visit our website at [[link removed]].
The trade statistics in May once again reflect more shifts in policy around tariffs rather than economic fundamentals. Nationally, the trade deficit [[link removed]] rose over the previous month as exports slowed more than imports, but imports remained well below recent months due to the steep variations in pre-tariff surges.
For California, trade through the state’s ports saw reduced activity, with total trade down $2.9 billion (-3.8%) from May 2024 and down $0.9 billion (-1.2%) from April 2025. Year-to-date numbers still show improvements over prior years in both nominal and real terms, but again primarily due to the trade surges at the beginning of the year and recent activity as shippers moved cargo ahead of the previous July 9 deadline for trade agreements. The effects on cargo shipments moving forward remain uncertain particularly since the current round of negotiations [[link removed]] with the EU and Asian countries focus on both overall trade levels as well as transshipments and content from China, as in the recent agreement [[link removed]] with Vietnam.
As we have discussed in the past, trade levels through the state are an important source of jobs, both through direct trade jobs along with jobs supported by the production of exports and use of imported components and materials. For example, although these jobs are now declining, the Los Angeles Region still remains the country’s leading manufacturing center and it remains in the position due in no small part to the presence of the ports and their ready access to production supplies and export markets.
Tariffs, however, are not the only factor affecting these job levels. Actions by both the state and local agencies continue to raise the costs of using the state’s ports, including actions that threaten to place artificial caps on overall trade activity. The state’s ports are already disadvantaged by higher costs relative to the rest of the US. Our recent study of the Ports of Los Angeles and Long Beach [[link removed]] cited previous studies showing the cost of using those ports for discretionary cargo compared to shipping through the Panama Canal ranged from $60 to about $1,000 per container depending on the destination. While the time savings by shipping through California can offset these costs in many cases, it does not in all, as shown by the increasing shift of this discretionary cargo to the other states.
And these costs are rising. While the current tariff uncertainty has provided another opportunity to blame California’s economic problems on yet another “Trump effect,” the state’s own actions are having a more fundamental detrimental effect on both competitive costs and the infrastructure required to support trade jobs. These include:
Indirect source proposals by South Coast [[link removed]] and potentially San Diego air districts. Air Resources Board Clean Truck requirements as they may be modified under the governor’s executive order [[link removed]] launching ACC III. Air Board’s At-Berth rules. AB 98 (2024) restrictions on new warehouses. Repeated litigation by the Attorney General on new warehouse construction. Distribution centers are specifically removed from the CEQA reforms recently enacted in SB 131, even though this infrastructure is critical to overall trade jobs, the only growth industry in recent years for jobs attaining the goals of the “abundance agenda” especially through the provision of middle-class wage jobs to workers with a high school education or less. Share of Goods through US Ports 16.6% CA Share of Total Trade Through US Ports
The share of total US goods trade (exports and imports) through California ports edged up to 16.57% (12 month moving average; compared to 16.62% in April 2025 and 15.83% in May 2024).
California remained the #2 state, behind Texas which had a 19.4% share (compared to 19.41% in April 2025 and 20.21% in May 2024). Trade through the Atlantic port states was at 30.11% (compared to 30.07% in April 2025 and 29.77% in May 2024). These trade flows form the trade-related base for one of California’s largest centers of middle-class, blue-collar jobs. Transportation & Warehousing alone provided 771,100 jobs in May 2025, compared to 758,100 in May 2024.
California Goods Exports $0.6 Billion Change in Exports
Total California origin goods exports rose $0.6 billion from May 2024 (up 4%). California remained in 2nd place with 8.97% of all US goods exports (12 month moving total), behind Texas at 21.56%.
California Goods Imports -$2.3 Billion Change in Imports
Total California destination goods imports dropped $2.3 billion from May 2024 (down -5.6%).
Top 20 Exports, May 2025
Top 20 exports by value are shown below, along with the change from May 2024.
Top 10 Export Markets, May 2025 The California Center for Jobs and the Economy provides an objective and definitive source of information pertaining to job creation and economic trends in California. [[link removed]] Contact 1301 I Street Sacramento, CA 95814 916.553.4093 If you no longer wish to receive these emails, select here to unsubscribe. [link removed]
Message Analysis
- Sender: California Center for Jobs and the Economy
- Political Party: n/a
- Country: United States
- State/Locality: California
- Office: n/a
-
Email Providers:
- Campaign Monitor