| From | Center for Jobs and the Economy <[email protected]> |
| Subject | California Trade Report for April 2025 |
| Date | June 5, 2025 10:30 PM |
Links have been removed from this email. Learn more in the FAQ.
Links have been removed from this email. Learn more in the FAQ.
Web Version [link removed] | Update Preferences [link removed] [link removed] California Trade Report
for April 2025
Below are highlights from the recently released April trade data from the US Census Bureau and US Bureau of Economic Analysis. This month’s release also includes the annual revisions, with changes to the data beginning in 2020. To view additional data and analysis related to the California economy visit our website at www.centerforjobs.org/ca [[link removed]].
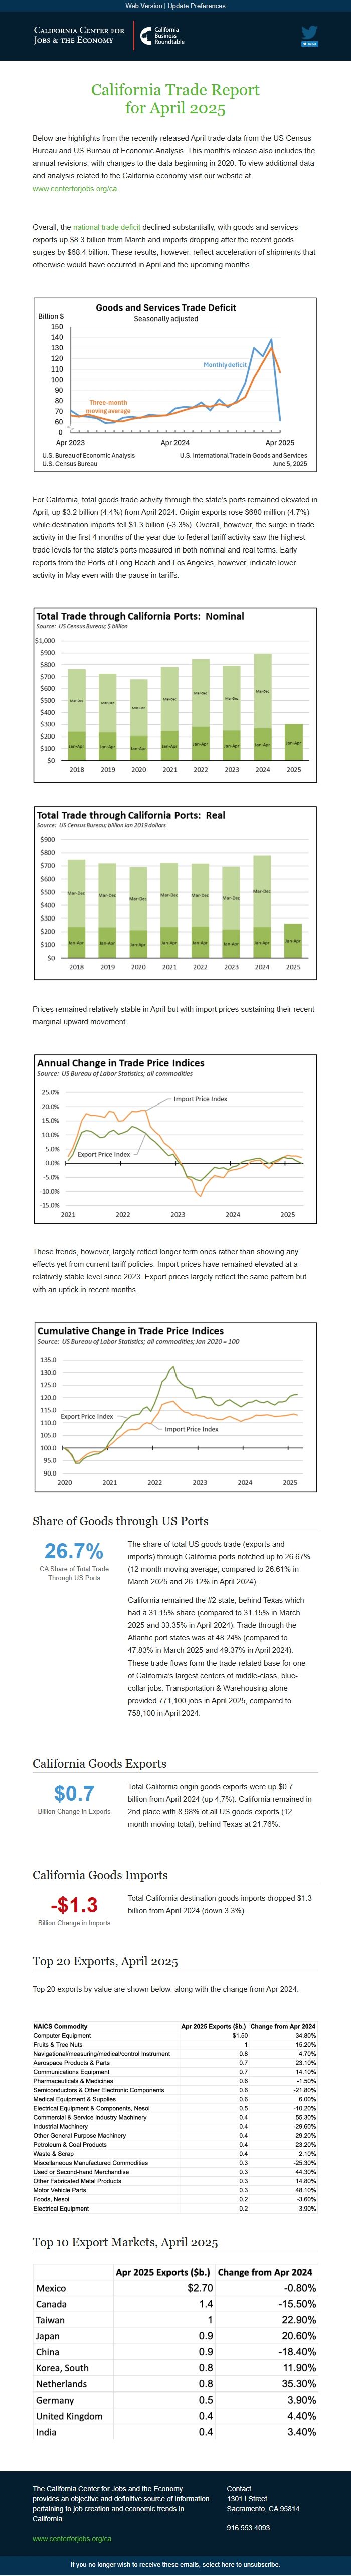
Overall, the national trade deficit [[link removed]] declined substantially, with goods and services exports up $8.3 billion from March and imports dropping after the recent goods surges by $68.4 billion. These results, however, reflect acceleration of shipments that otherwise would have occurred in April and the upcoming months.
For California, total goods trade activity through the state’s ports remained elevated in April, up $3.2 billion (4.4%) from April 2024. Origin exports rose $680 million (4.7%) while destination imports fell $1.3 billion (-3.3%). Overall, however, the surge in trade activity in the first 4 months of the year due to federal tariff activity saw the highest trade levels for the state’s ports measured in both nominal and real terms. Early reports from the Ports of Long Beach and Los Angeles, however, indicate lower activity in May even with the pause in tariffs.
Prices remained relatively stable in April but with import prices sustaining their recent marginal upward movement.
These trends, however, largely reflect longer term ones rather than showing any effects yet from current tariff policies. Import prices have remained elevated at a relatively stable level since 2023. Export prices largely reflect the same pattern but with an uptick in recent months.
Share of Goods through US Ports 26.7% CA Share of Total Trade Through US Ports
The share of total US goods trade (exports and imports) through California ports notched up to 26.67% (12 month moving average; compared to 26.61% in March 2025 and 26.12% in April 2024).
California remained the #2 state, behind Texas which had a 31.15% share (compared to 31.15% in March 2025 and 33.35% in April 2024). Trade through the Atlantic port states was at 48.24% (compared to 47.83% in March 2025 and 49.37% in April 2024). These trade flows form the trade-related base for one of California’s largest centers of middle-class, blue-collar jobs. Transportation & Warehousing alone provided 771,100 jobs in April 2025, compared to 758,100 in April 2024.
California Goods Exports $0.7 Billion Change in Exports
Total California origin goods exports were up $0.7 billion from April 2024 (up 4.7%). California remained in 2nd place with 8.98% of all US goods exports (12 month moving total), behind Texas at 21.76%.
California Goods Imports -$1.3 Billion Change in Imports
Total California destination goods imports dropped $1.3 billion from April 2024 (down 3.3%).
Top 20 Exports, April 2025
Top 20 exports by value are shown below, along with the change from Apr 2024.
Top 10 Export Markets, April 2025 The California Center for Jobs and the Economy provides an objective and definitive source of information pertaining to job creation and economic trends in California. [[link removed]] Contact 1301 I Street Sacramento, CA 95814 916.553.4093 If you no longer wish to receive these emails, select here to unsubscribe. [link removed]
for April 2025
Below are highlights from the recently released April trade data from the US Census Bureau and US Bureau of Economic Analysis. This month’s release also includes the annual revisions, with changes to the data beginning in 2020. To view additional data and analysis related to the California economy visit our website at www.centerforjobs.org/ca [[link removed]].
Overall, the national trade deficit [[link removed]] declined substantially, with goods and services exports up $8.3 billion from March and imports dropping after the recent goods surges by $68.4 billion. These results, however, reflect acceleration of shipments that otherwise would have occurred in April and the upcoming months.
For California, total goods trade activity through the state’s ports remained elevated in April, up $3.2 billion (4.4%) from April 2024. Origin exports rose $680 million (4.7%) while destination imports fell $1.3 billion (-3.3%). Overall, however, the surge in trade activity in the first 4 months of the year due to federal tariff activity saw the highest trade levels for the state’s ports measured in both nominal and real terms. Early reports from the Ports of Long Beach and Los Angeles, however, indicate lower activity in May even with the pause in tariffs.
Prices remained relatively stable in April but with import prices sustaining their recent marginal upward movement.
These trends, however, largely reflect longer term ones rather than showing any effects yet from current tariff policies. Import prices have remained elevated at a relatively stable level since 2023. Export prices largely reflect the same pattern but with an uptick in recent months.
Share of Goods through US Ports 26.7% CA Share of Total Trade Through US Ports
The share of total US goods trade (exports and imports) through California ports notched up to 26.67% (12 month moving average; compared to 26.61% in March 2025 and 26.12% in April 2024).
California remained the #2 state, behind Texas which had a 31.15% share (compared to 31.15% in March 2025 and 33.35% in April 2024). Trade through the Atlantic port states was at 48.24% (compared to 47.83% in March 2025 and 49.37% in April 2024). These trade flows form the trade-related base for one of California’s largest centers of middle-class, blue-collar jobs. Transportation & Warehousing alone provided 771,100 jobs in April 2025, compared to 758,100 in April 2024.
California Goods Exports $0.7 Billion Change in Exports
Total California origin goods exports were up $0.7 billion from April 2024 (up 4.7%). California remained in 2nd place with 8.98% of all US goods exports (12 month moving total), behind Texas at 21.76%.
California Goods Imports -$1.3 Billion Change in Imports
Total California destination goods imports dropped $1.3 billion from April 2024 (down 3.3%).
Top 20 Exports, April 2025
Top 20 exports by value are shown below, along with the change from Apr 2024.
Top 10 Export Markets, April 2025 The California Center for Jobs and the Economy provides an objective and definitive source of information pertaining to job creation and economic trends in California. [[link removed]] Contact 1301 I Street Sacramento, CA 95814 916.553.4093 If you no longer wish to receive these emails, select here to unsubscribe. [link removed]
Message Analysis
- Sender: California Center for Jobs and the Economy
- Political Party: n/a
- Country: United States
- State/Locality: California
- Office: n/a
-
Email Providers:
- Campaign Monitor