|
Since the release of our Winter 2024 newsletter, the WSGS has published a number of important new products that further our mission to characterize Wyoming’s geology and provide accessible geoscience information to the public. These publications span topics from data standardization and geologic hazard modeling to resource development and infrastructure mapping. Below, we highlight four key releases from the past season.
Standardizing the State: GeMS Conversions Enhance Access to Bedrock Mapping Data
In May 2025, the WSGS completed a major data modernization effort by converting 28 legacy 1:100,000-scale bedrock geologic maps into the Geologic Map Schema (GeMS), a standardized format developed by the U.S. Geological Survey (USGS) for the digital publication of geologic map data. These updates span maps originally published between 1992 and 2011 and represent decades of geological fieldwork conducted across a broad range of Wyoming's geologic provinces.
The transition to GeMS format is a foundational step in building a seamless, statewide 1:100,000-scale geologic database—an essential tool for everything from academic research and natural resource development to infrastructure planning and environmental assessments. Prior to this conversion, each map existed as a standalone product with unique formatting and symbology, making integration difficult and prone to misinterpretation.
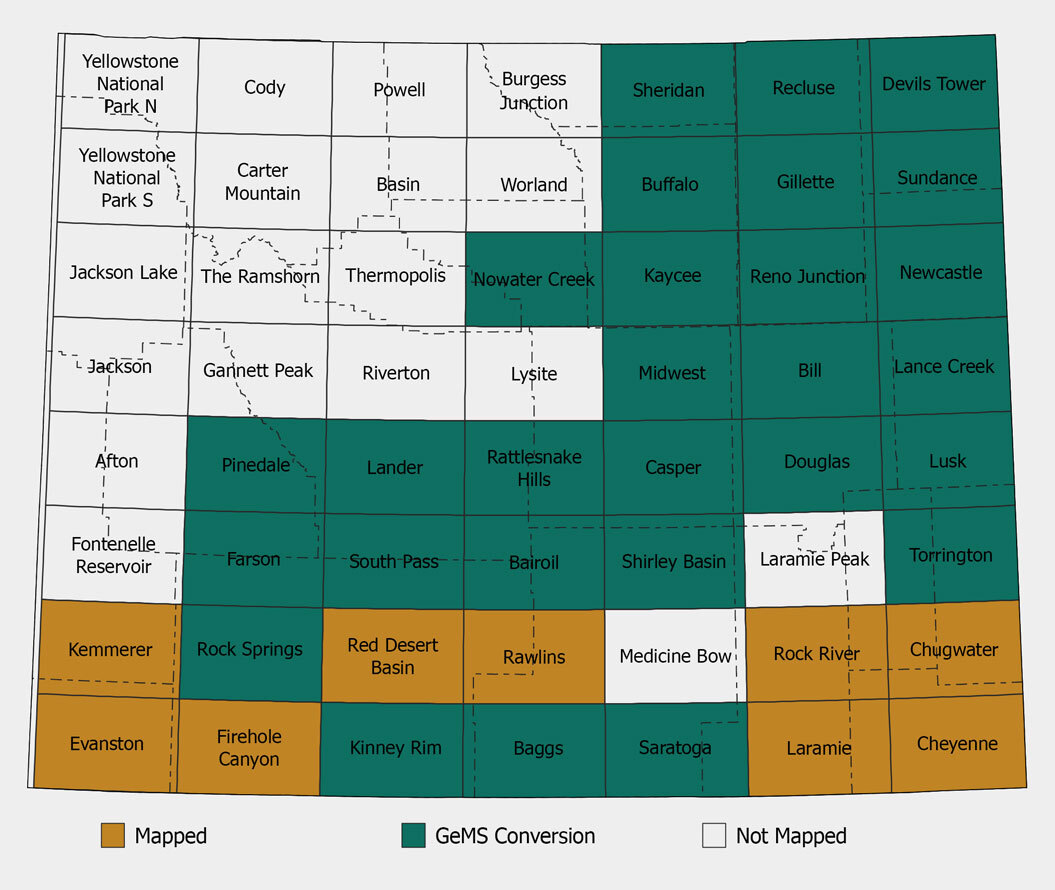 Map of 1:100,000-scale bedrock maps in Wyoming
What is GeMS?
The Geologic Map Schema (GeMS) is a nationally adopted data model that standardizes the way geologic map information is stored and shared. Developed through collaboration between the USGS and state geological surveys, GeMS defines a consistent set of database tables, field names, and coding rules that improve interoperability across platforms and between organizations. It bridges the gap between traditional cartography and modern GIS, allowing users to more easily query, visualize, and analyze geological features.
Adopting GeMS allows the WSGS to:
- Provide geologic data in widely used GIS formats (shapefiles and file geodatabases)
- Harmonize geologic unit terminology and symbology across disparate datasets
- Reduce the need for manual reconciliation of map inconsistencies
- Establish a consistent framework for future mapping projects
Project Scope and Impact
As of spring 2025, the WSGS has completed GeMS conversions for 28 quadrangles—roughly half of the published 1:100,000-scale geologic maps in the state. These maps cover diverse geological settings, including the Bighorn Basin, Wind River Basin, Powder River Basin, and Laramide uplifts, and represent some of the most heavily studied and economically significant areas of Wyoming.
“Standardizing these maps in a digital format makes them significantly more useful for a wide range of users—from local planners and engineers to academic researchers and exploration geologists,” said Dr. Erin Campbell, WSGS Director and Wyoming State Geologist. “It supports better decision-making through more accessible, high-quality geologic data.”
Each dataset includes an abstract, metadata, and fully attributed GIS files. These products are available individually and are intended to support both standalone and regional-scale geologic investigations. The effort was partially funded by the USGS National Cooperative Geologic Mapping Program (NCGMP), which promotes collaboration between federal and state agencies to improve geologic mapping nationwide.
To explore the converted data or download individual map packages, visit wsgs.wyo.gov.
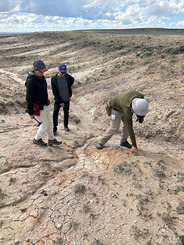
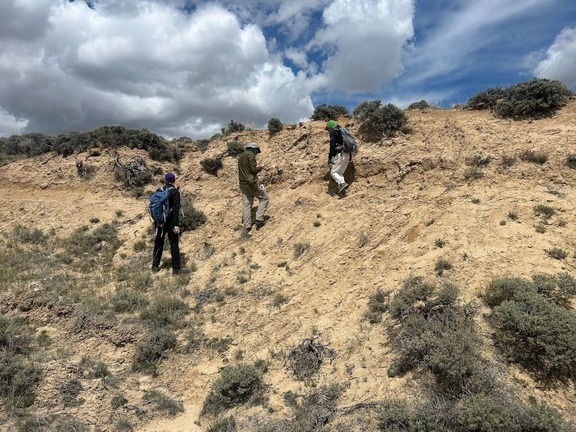
New Quadrangle Maps: Rawlins and Red Desert Basin
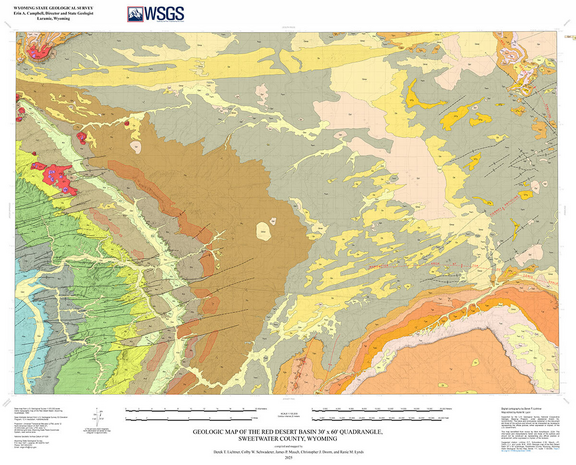 Portion of WSGS Map Series 111, Geologic map of the Red Desert Basin 30' x 60' quadrangle, Sweetwater County, Wyoming
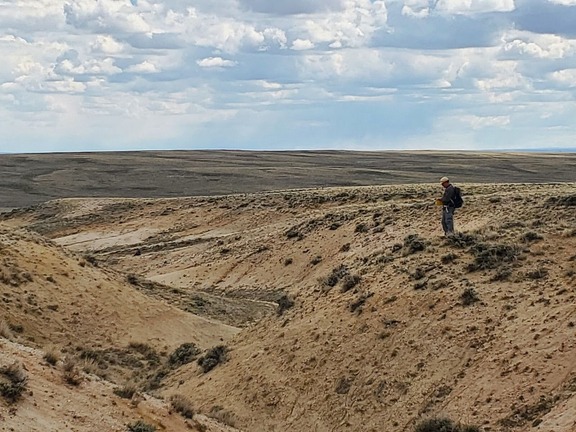
In early 2025, the WSGS released updated geologic maps of the Rawlins and Red Desert Basin 30′ x 60′ quadrangles—two cornerstone regions in Wyoming’s central southern corridor. These maps represent a significant advancement in both geologic accuracy and data resolution, shedding new light on the complex structures and resources found within the greater Great Divide Basin region.
Together, these quadrangles cover a broad area extending from the Killpecker Sand Dunes in the north to Miller Hill and the Delaney Rim in the south, and from Rock Springs in the west to beyond Rawlins in the east. These maps now serve as some of the most up-to-date regional references available for this part of the state.
Modern Tools for Complex Geology
The updated maps incorporate extensive new fieldwork, detailed stratigraphic reinterpretation, and high-resolution lidar data to refine bedrock contacts, fault traces, and surficial unit delineations. Geologists placed particular emphasis on unraveling the complex structural relationships within the Rawlins and Rock Springs uplifts, along with sedimentary basin-fill relationships in the Great Divide Basin, northern Atlantic Rim, and parts of the Washakie Basin.
Geologic formations in this area range primarily from Cretaceous to Quaternary in age, though exposures of Paleozoic, Mesozoic, and even Precambrian rocks occur, especially in uplifted zones. This broad temporal span makes the region an important resource for understanding the tectonic and depositional history of southern Wyoming.
“These maps reflect some of the most challenging and geologically rich terrain in the state,” said WSGS Director and State Geologist Dr. Erin Campbell. “They provide a better foundation for understanding energy resources, stratigraphy, and structure in an area where multiple basins and uplifts converge.”
Applications for Industry and Infrastructure
The updated quadrangles are particularly valuable for energy and mineral resource evaluations. The region is known to host deposits of uranium, coal, and hydrocarbon resources, and is also under evaluation for carbon dioxide (CO₂) sequestration potential. The maps improve subsurface correlation and provide important context for ongoing and future exploration.
The area’s significance is amplified by its infrastructure: it encompasses a major segment of U.S. Interstate 80, portions of U.S. Highway 287, and the Union Pacific Railroad corridor. Accurate geologic mapping in this region is critical for planning around geologic hazards, land-use decisions, and transportation development.
Both maps are published as part of the WSGS Map Series and are accompanied by (GeM) Level 3-compliant geodatabases that allow users to interact with and analyze the data digitally. Supporting documentation includes map pamphlets with detailed descriptions of units, structure, and mapping methods.
The Rawlins and Red Desert Basin quadrangle maps are available for download from the WSGS website, along with metadata, geodatabases, and printable map plates.
Mapping Landslide Risk: New Teton County Susceptibility Model Released
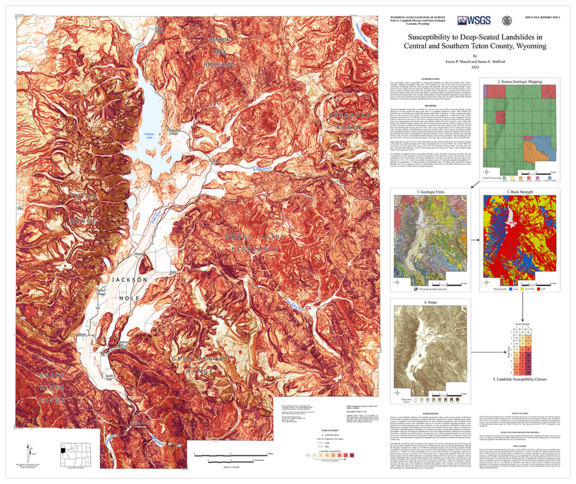 Map plate from WSGS Open File Report 2025-1 showing deep-seated landslide susceptibility in central and southern Teton County. Darker red colors symbolize regions of higher susceptibility.
In March 2025, the WSGS released a landmark geologic hazard product: a high-resolution susceptibility map identifying areas most prone to deep-seated landslides in central and southern Teton County. Published as Open File Report 2025-1, the study is the most detailed statewide effort to date for this landslide type and provides essential tools for emergency planners, local governments, engineers, and landowners in one of Wyoming’s most geologically active regions.
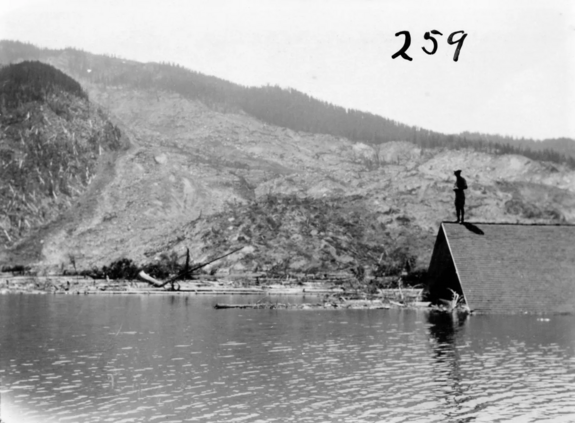
Teton County has long been synonymous with landslide risk. From the massive Gros Ventre Slide of 1925, which destroyed the town of Kelly, to more recent events like the Budge Drive and Big Fill landslides, slope instability continues to pose a threat to property, infrastructure, and public safety. This report helps fill a critical knowledge gap by identifying exactly where deep-seated landslides are most likely to occur and under what geologic conditions.
A New Standard for Landslide Modeling
The mapping effort was led by James Mauch, WSGS geologist and lead author, and James Stafford, WSGS geohydrologist. The team used a combination of 57 geologic maps and high-resolution lidar elevation data to build a susceptibility model with a 10-meter raster resolution—a level of detail rarely achieved in regional landslide hazard mapping. The model evaluates the relationship between slope angle and bedrock strength to predict areas of increased landslide potential.
The resulting susceptibility raster was validated against an independent dataset of more than 2,100 mapped landslides, ensuring the model’s reliability and relevance to real-world conditions. The analysis found that approximately 84 percent of the study area is at least marginally susceptible to deep-seated landslides, reflecting the widespread presence of steep slopes, weak lithologies, and geologically young terrain across the region.
“This is an excellent example of how geoscience can support public safety and smart land-use decisions,” said Dr. Erin Campbell, WSGS Director and State Geologist. “Landslide susceptibility maps are a powerful way to translate complex geologic data into something practical and actionable.”
Supporting Smart Growth and Risk Mitigation
The susceptibility map is intended to support a range of applications, including:
- Land-use planning and zoning decisions by local governments
- Emergency management preparedness and hazard mitigation
- Engineering site assessments for residential and commercial development
- Insurance risk evaluations for geologic hazards
Importantly, the authors emphasize that the model focuses exclusively on deep-seated landslides, which typically involve large, slow-moving masses of rock or soil. It does not account for shallow landslides, rockfalls, or debris flows—hazards that may still be present in some areas but require different modeling approaches.
The report includes a technical discussion of the model’s limitations, such as its exclusion of external triggering mechanisms like seismic events or intense rainfall. This transparency helps users apply the data appropriately and understand its scope.
Access and Interactivity
The full report, GIS raster data, and printable map plate are available for free download on the WSGS website. The landslide susceptibility data can also be viewed on the Wyoming Geologic Hazards Map, an interactive web-based tool that allows users to explore hazard data by region, scale, and land parcel.
With development pressure increasing in mountainous regions of northwest Wyoming, this new map is a timely and important tool for reducing landslide risk and promoting resilient communities.
Oil and Gas, Online and Updated: Interactive Map Adds New Data and Capabilities
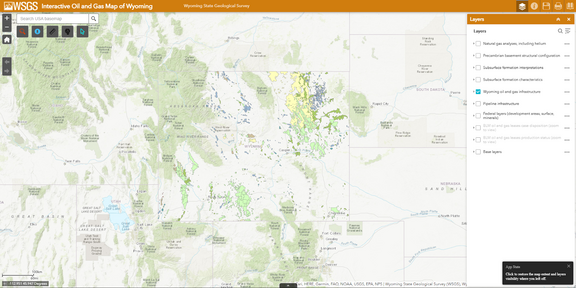 Screenshot of the WSGS Interactive Oil and Gas Map of Wyoming, showing current infrastructure layers across the state. The web-based platform allows users to explore well data, pipelines, production facilities, and subsurface interpretations with downloadable geospatial datasets
In April 2025, the Wyoming State Geological Survey released the seventh major update to its interactive oil and gas map—a web-based platform that delivers public access to thousands of wells, fields, facilities, and supporting geologic data across the state. The update brings not only new data but also greater detail and improved accuracy, solidifying the map’s reputation as one of WSGS’s most widely used digital tools.
Originally launched in 2016, the interactive map was developed to build on the legacy of the WSGS’s traditional printed oil and gas maps, which have been in production since 1915. The digital version has since become indispensable for industry professionals, land managers, private citizens, academic researchers, and state and federal agencies, offering the flexibility and functionality of modern GIS technology.
“This platform allows us to keep Wyoming’s vital energy data current and accessible,” said Dr. Erin Campbell, WSGS Director and State Geologist. “While I still appreciate the value of a printed map, having this resource available in real-time is much more practical for today’s users.”
What’s New in This Release?
The 2025 update includes:
- 450+ new wells in named oil and gas fields
- 1,650+ new and historical wildcat wells
- Updated facility data, including pipelines, gas plants, and refineries
- Cross-verified well status and production information using datasets from the Wyoming Oil and Gas Conservation Commission (WOGCC)
Much of the effort behind this update involved data cleaning and quality control. WSGS geologists compared WOGCC well data with historical maps, reports, and records to ensure accurate well locations, production histories, and status classifications.
“It may look like a subtle change to the interface, but each update involves hundreds of hours of data validation and integration,” said Jeremy Ring, WSGS geologist and one of the map’s curators. “The accuracy of these datasets is crucial for decisions that affect exploration, permitting, and land management.”
A Public Resource with Powerful Tools
The map allows users to:
- Filter and query by location, field, operator, or status
- Download data within user-defined boundaries in formats including .csv, GeoJSON, and ArcGIS feature collections
- Access production data, horizontal and vertical well locations, and infrastructure footprints
- Visualize trends in field development, well density, and resource distribution
The update reinforces WSGS’s commitment to transparency and public service. All map layers and supporting data are free to access and download through the WSGS Oil and Gas Resources portal. Users can explore statewide trends or zero in on a particular township, range, or field of interest with ease.
Supporting Resource Management and Energy Education
Beyond its technical capabilities, the interactive map also plays an important role in supporting Wyoming’s energy literacy. By making complex geologic and production data readily accessible, the platform enables better understanding of how oil and gas resources are developed, where infrastructure is located, and what changes have occurred over time.
“The interactive map is part of a broader mission to make geoscience more approachable and usable,” said Dr. Raul Ochoa, WSGS geologist and data reviewer for the project. “We want to give people the tools to ask informed questions and engage with the state’s energy future.”
With this latest release, the WSGS continues to provide critical infrastructure for understanding and responsibly managing Wyoming’s vast hydrocarbon resources.
Visit the WSGS website to access the interactive oil and gas map and download the latest datasets.
|