| From | USAFacts <[email protected]> |
| Subject | Do women live longer than men in the US? |
| Date | April 22, 2025 1:30 AM |
Links have been removed from this email. Learn more in the FAQ.
Links have been removed from this email. Learn more in the FAQ.
[View in Your Browser]([link removed])
[USAFacts]([link removed])
Why women outlive men in the US
Let’s talk about life expectancy. Women tend to live longer than men — but by how much, and why? There’s a range of reasons. [Here's what the data says]([link removed]) about longevity (and maybe an extra reminder to schedule your next checkup).
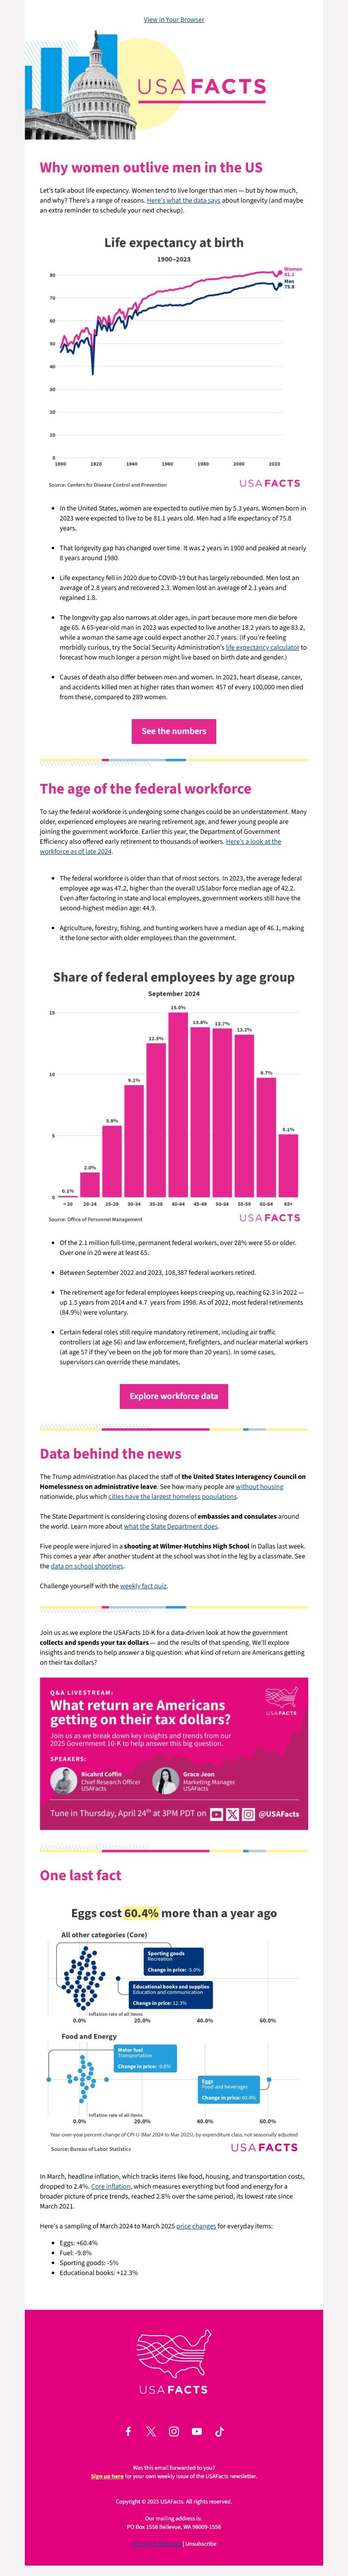
[Life expectancy at birth]([link removed])
- In the United States, women are expected to outlive men by 5.3 years. Women born in 2023 were expected to live to be 81.1 years old. Men had a life expectancy of 75.8 years.
- That longevity gap has changed over time. It was 2 years in 1900 and peaked at nearly 8 years around 1980.
- Life expectancy fell in 2020 due to COVID-19 but has largely rebounded. Men lost an average of 2.8 years and recovered 2.3. Women lost an average of 2.1 years and regained 1.8.
- The longevity gap also narrows at older ages, in part because more men die before age 65. A 65-year-old man in 2023 was expected to live another 18.2 years to age 83.2, while a woman the same age could expect another 20.7 years. (If you’re feeling morbidly curious, try the Social Security Administration’s [life expectancy calculator]([link removed]) to forecast how much longer a person might live based on birth date and gender.)
- Causes of death also differ between men and women. In 2023, heart disease, cancer, and accidents killed men at higher rates than women: 457 of every 100,000 men died from these, compared to 289 women.
[See the numbers]([link removed])
The age of the federal workforce
To say the federal workforce is undergoing some changes could be an understatement. Many older, experienced employees are nearing retirement age, and fewer young people are joining the government workforce. Earlier this year, the Department of Government Efficiency also offered early retirement to thousands of workers. [Here’s a look at the workforce as of late 2024]([link removed]).
- The federal workforce is older than that of most sectors. In 2023, the average federal employee age was 47.2, higher than the overall US labor force median age of 42.2. Even after factoring in state and local employees, government workers still have the second-highest median age: 44.9.
- Agriculture, forestry, fishing, and hunting workers have a median age of 46.1, making it the lone sector with older employees than the government.
[Share of federal employees by age group]([link removed])
- Of the 2.1 million full-time, permanent federal workers, over 28% were 55 or older. Over one in 20 were at least 65.
- Between September 2022 and 2023, 108,387 federal workers retired.
- The retirement age for federal employees keeps creeping up, reaching 62.3 in 2022 — up 1.5 years from 2014 and 4.7 years from 1998. As of 2022, most federal retirements (84.9%) were voluntary.
- Certain federal roles still require mandatory retirement, including air traffic controllers (at age 56) and law enforcement, firefighters, and nuclear material workers (at age 57 if they’ve been on the job for more than 20 years). In some cases, supervisors can override these mandates.
[Explore workforce data]([link removed])
Data behind the news
The Trump administration has placed the staff of the United States Interagency Council on Homelessness on administrative leave. See how many people are [without housing]([link removed]) nationwide, plus which [cities have the largest homeless populations]([link removed]).
The State Department is considering closing dozens of embassies and consulates around the world. Learn more about [what the State Department does]([link removed]).
Five people were injured in a shooting at Wilmer-Hutchins High School in Dallas last week. This comes a year after another student at the school was shot in the leg by a classmate. See the [data on school shootings]([link removed]).
Challenge yourself with the [weekly fact quiz]([link removed]).
Join us as we explore the USAFacts 10-K for a data-driven look at how the government collects and spends your tax dollars — and the results of that spending. We’ll explore insights and trends to help answer a big question: what kind of return are Americans getting on their tax dollars?
[Live stream]([link removed])
One last fact
[Egg cost]([link removed])
In March, headline inflation, which tracks items like food, housing, and transportation costs, dropped to 2.4%. [Core inflation]([link removed]), which measures everything but food and energy for a broader picture of price trends, reached 2.8% over the same period, its lowest rate since March 2021.
Here's a sampling of March 2024 to March 2025 [price changes]([link removed]) for everyday items:
- Eggs: +60.4%
- Fuel: -9.8%
- Sporting goods: -5%
- Educational books: +12.3%
[USAFacts]([link removed])
[Facebook]([link removed])
[X]([link removed])
[Instagram]([link removed])
[YouTube]([link removed])
[Tiktok]([link removed])
Was this email forwarded to you?
[Sign up here]([link removed]) for your own weekly issue of the USAFacts newsletter.
Copyright © 2025 USAFacts. All rights reserved.
Our mailing address is:
PO Box 1558 Bellevue, WA 98009-1558
[Manage Preferences]([link removed]) | [Unsubscribe]([link removed])
[USAFacts]([link removed])
Why women outlive men in the US
Let’s talk about life expectancy. Women tend to live longer than men — but by how much, and why? There’s a range of reasons. [Here's what the data says]([link removed]) about longevity (and maybe an extra reminder to schedule your next checkup).
[Life expectancy at birth]([link removed])
- In the United States, women are expected to outlive men by 5.3 years. Women born in 2023 were expected to live to be 81.1 years old. Men had a life expectancy of 75.8 years.
- That longevity gap has changed over time. It was 2 years in 1900 and peaked at nearly 8 years around 1980.
- Life expectancy fell in 2020 due to COVID-19 but has largely rebounded. Men lost an average of 2.8 years and recovered 2.3. Women lost an average of 2.1 years and regained 1.8.
- The longevity gap also narrows at older ages, in part because more men die before age 65. A 65-year-old man in 2023 was expected to live another 18.2 years to age 83.2, while a woman the same age could expect another 20.7 years. (If you’re feeling morbidly curious, try the Social Security Administration’s [life expectancy calculator]([link removed]) to forecast how much longer a person might live based on birth date and gender.)
- Causes of death also differ between men and women. In 2023, heart disease, cancer, and accidents killed men at higher rates than women: 457 of every 100,000 men died from these, compared to 289 women.
[See the numbers]([link removed])
The age of the federal workforce
To say the federal workforce is undergoing some changes could be an understatement. Many older, experienced employees are nearing retirement age, and fewer young people are joining the government workforce. Earlier this year, the Department of Government Efficiency also offered early retirement to thousands of workers. [Here’s a look at the workforce as of late 2024]([link removed]).
- The federal workforce is older than that of most sectors. In 2023, the average federal employee age was 47.2, higher than the overall US labor force median age of 42.2. Even after factoring in state and local employees, government workers still have the second-highest median age: 44.9.
- Agriculture, forestry, fishing, and hunting workers have a median age of 46.1, making it the lone sector with older employees than the government.
[Share of federal employees by age group]([link removed])
- Of the 2.1 million full-time, permanent federal workers, over 28% were 55 or older. Over one in 20 were at least 65.
- Between September 2022 and 2023, 108,387 federal workers retired.
- The retirement age for federal employees keeps creeping up, reaching 62.3 in 2022 — up 1.5 years from 2014 and 4.7 years from 1998. As of 2022, most federal retirements (84.9%) were voluntary.
- Certain federal roles still require mandatory retirement, including air traffic controllers (at age 56) and law enforcement, firefighters, and nuclear material workers (at age 57 if they’ve been on the job for more than 20 years). In some cases, supervisors can override these mandates.
[Explore workforce data]([link removed])
Data behind the news
The Trump administration has placed the staff of the United States Interagency Council on Homelessness on administrative leave. See how many people are [without housing]([link removed]) nationwide, plus which [cities have the largest homeless populations]([link removed]).
The State Department is considering closing dozens of embassies and consulates around the world. Learn more about [what the State Department does]([link removed]).
Five people were injured in a shooting at Wilmer-Hutchins High School in Dallas last week. This comes a year after another student at the school was shot in the leg by a classmate. See the [data on school shootings]([link removed]).
Challenge yourself with the [weekly fact quiz]([link removed]).
Join us as we explore the USAFacts 10-K for a data-driven look at how the government collects and spends your tax dollars — and the results of that spending. We’ll explore insights and trends to help answer a big question: what kind of return are Americans getting on their tax dollars?
[Live stream]([link removed])
One last fact
[Egg cost]([link removed])
In March, headline inflation, which tracks items like food, housing, and transportation costs, dropped to 2.4%. [Core inflation]([link removed]), which measures everything but food and energy for a broader picture of price trends, reached 2.8% over the same period, its lowest rate since March 2021.
Here's a sampling of March 2024 to March 2025 [price changes]([link removed]) for everyday items:
- Eggs: +60.4%
- Fuel: -9.8%
- Sporting goods: -5%
- Educational books: +12.3%
[USAFacts]([link removed])
[Facebook]([link removed])
[X]([link removed])
[Instagram]([link removed])
[YouTube]([link removed])
[Tiktok]([link removed])
Was this email forwarded to you?
[Sign up here]([link removed]) for your own weekly issue of the USAFacts newsletter.
Copyright © 2025 USAFacts. All rights reserved.
Our mailing address is:
PO Box 1558 Bellevue, WA 98009-1558
[Manage Preferences]([link removed]) | [Unsubscribe]([link removed])
Message Analysis
- Sender: USAFacts
- Political Party: n/a
- Country: United States
- State/Locality: n/a
- Office: n/a
-
Email Providers:
- Klaviyo