Data.census.gov Newsletter – March 2025
In March, we’re highlighting the latest updates to data.census.gov, with a focus on improvements to the Microdata Access Tool (MDAT). These enhancements make it easier to customize and analyze microdata, improving the overall user experience.
What's New?
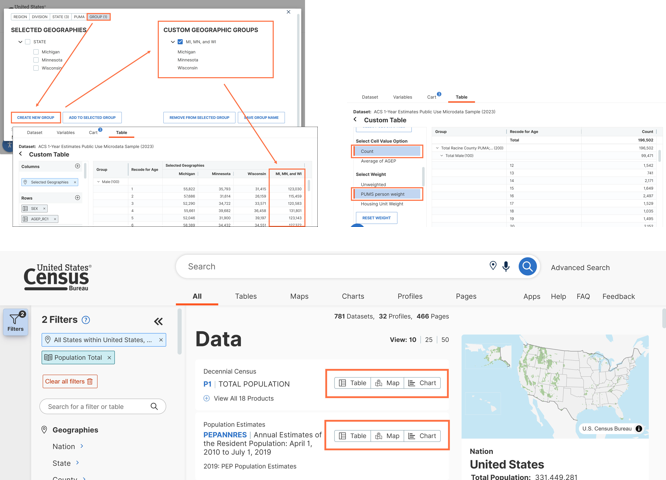
Improved Table Layout and Customization
- A new geography group tab lets you easily retrieve data for a customized set of geographies already added together for them.
- Variables in the columns and rows section now stay visible while you work. You won't have to scroll excessively to keep track of your selections.
- When moving variables in a table, a new visual guide (three vertical dots) will show exactly where they’ll be placed, making customization easier.
- Better menu visibility: Selected menu items are now highlighted with orange bars and blue shading, improving clarity across the site.
Streamlined "All Results" Page
- You will now see previous labels consolidated into a single “Data” header, with new buttons to access tables, maps, or charts. This reduces the number of clicks and scrolling required to navigate to the full set of table and visualization options.
Geographic Selection Improvements
- Streamlined PUMA selection: When you select a Public Use Microdata Area (PUMA), the system now automatically selects the corresponding state, making it easier to work with geographic variables.
How These Updates Help You
These enhancements improve efficiency and navigation, making it easier to find, select, and organize data without unnecessary steps. Whether you’re a frequent MDAT user or just getting started, these updates ensure a smoother, more intuitive experience.
- Try out these new features on MDAT today, and explore how they can improve your workflow!
Have feedback? We’d love to hear from you! Let us know how these updates are working for you at [email protected].
Featured Question
Why Does My Table Not Show All of My Selected Geographies?
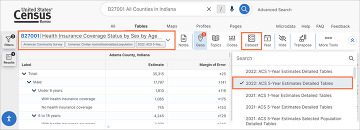
When the returned results do not produce the expected number of geographies, it is often a result of the American Community Survey (ACS) 1-year estimates being used, instead of the 5-year estimates. ACS 1-year estimates are only available for geographies with 65,000 people or more, and the tables go through additional data quality filtering. To change the table from the 1-year estimates to the 5-year estimates, use the "Product" drop-down menu found near the top of the table.
Switching from the 1-year to the 5-year estimates will provide data for the remainder of the geographies.
Email us at [email protected] for any questions or comments you may have. For more guidance on data availability and using data.census.gov, the Census API, and Microdata Access, visit our Resources page.
Help us spread the word about Census Bureau data!
Share this on social media or forward it to a friend.
|