In his essential On Tyranny, Timothy Snyder warns us not to “obey in advance” if we want to defend ourselves from impending tyranny. To that admonition, I would add “don’t praise in advance” – don’t take at face value the media herd now telling us that Trump and his agenda are more popular than they actually are, lest it become a self-fulfilling prophecy.
As I wrote in How Trump “Won,” despite the rush to see Trump’s election as sweeping or historic, it was, in fact, one of the narrowest wins ever. I further argued that what was remarkable was that, despite widespread dissatisfaction with the direction of the country and the performance of the Democratic administration, Trump came as close to losing as he did.
It was especially telling that most of the “swing” from 2020 to 2024 was how many fewer votes Harris received than Biden had, and that about 70 percent of that drop came in the Bluest places in America. In all, according to VoteCast, about 19 million1 people who voted for Biden in 2020 stayed home in 2024.
Some have speculated that the drop in support for Democrats by Blue county voters was actually about their warming to the MAGA program, albeit not enough to bother voting for Trump. But a closer look at 538’s average of Trump’s post-inaugural approval ratings offers more evidence that Trump and his agenda have not, in fact, grown more popular with Americans.
Political analysts usually talk about presidents enjoying a “bump” in popularity after they are elected, as voters who merely preferred the winner’s opponent (as opposed to actively disliking the winner) come on board after Election Day, most likely hoping for the best. In that regard, it’s telling that Trump’s approval rating is no better than his share of the vote three months ago.
While it’s standard to think of presidents’ initial approval ratings, it’s also very much worth looking at presidential disapproval ratings. And here, Trump really stands out. He now has the highest beginning disapproval in the record by a substantial margin.
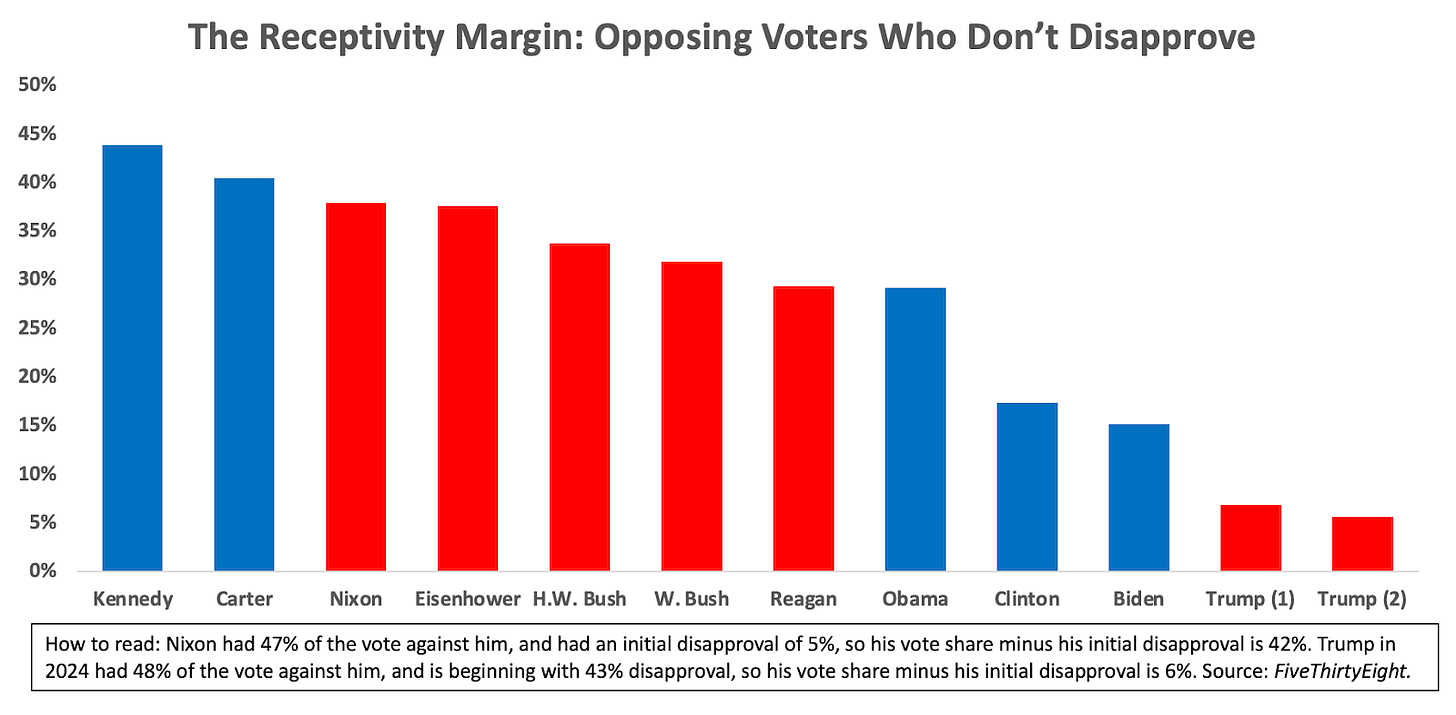
But, now, let’s take that a step further, to look at what I’ll name the “Receptivity Margin.” By that I mean the difference between the percentage of people who voted against the president on Election Day, and the percentage of people who register disapproval in surveys.2 If the Biden voters who stayed home were, in fact, doing so because they were Trump-curious, that should definitely show up here. But as the next graph makes clear, the receptivity margin has never been as small as it is now for Trump – and by a lot.
 Now remember: The universal consensus going into the election, and since, has been that Harris was more popular with those who voted (or were more likely to vote) than those who didn’t (or were less likely to vote). Nary a pre-election piece didn’t warn of the disaster awaiting Democrats if too many people voted, and many post-election analyses argued that greater turnout wouldn’t have helped Harris. Their argument was essentially that those who were most disapproving of Trump were the most likely to vote, which, of course, means that those who were less likely to vote were less disapproving of Trump. Furthermore, they argued that this was a noteworthy reversal when, in previous cycles, it has been taken for granted that those less likely to vote were also more likely to vote for the Democrat.
Now, if that argument were true, we would expect, ex ante, that Trump’s receptivity margin would be greater than it had been for previous presidents. (Approval ratings include non-voters) But the opposite is true. In reality, we see the lowest receptivity margin on record, even lower than in 2016.
The abstention of 19 million Biden 2020 voters should be understood as a vote of no confidence in Democrats, not a yearning for Trump or the MAGA agenda. Indeed, while there are always many factors at play, lack of alarm about the dangers of a second Trump Administration – a credulity gap – clearly mattered. Those who didn’t vote for Harris (including people who didn’t vote at all) were much less likely to believe Trump would actually implement the agenda that he and his allies promised.
So, here we are again. The only way to convince yourself that 2024 was about “America moved right!” is to live in the ”Flatland” polling simulacrum, where unfalsifiable claims run wild and where it’s easy to claim that the arithmetic impact of abstention is actually affirmation.
Again, as I wrote:
The defining feature of American politics this century is that neither party can “win” elections anymore; they can only be the “not-loser.” Only thanks to the two-party system can the not-loser be crowned the “winner,” since there is no way to fire the incumbent party without hiring the opposition party. Yet political commentators keep confusing shifts in the two parties’ electoral fortunes with changes in voters’ basic values or priorities. A collapse in support for Democrats does not mean that most Americans, especially in Blue America, are suddenly eager to live in an illiberal theocracy.
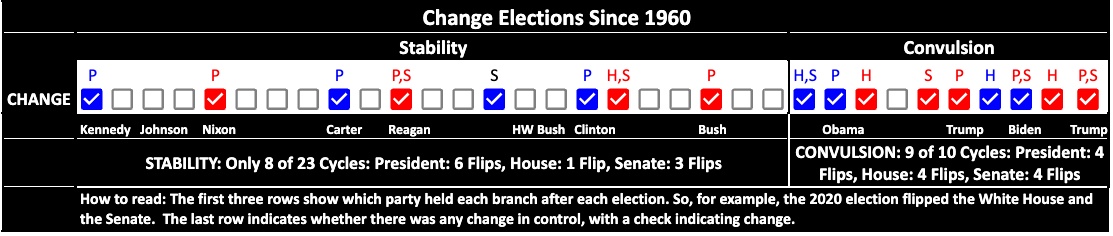
Consider that only once before in American history have three consecutive presidential elections seen the White House change partisan hands, and that nine out of the last ten midterm or presidential elections have been “change elections,” in the sense that either the presidency, the House, or the Senate changed partisan hands, which is completely unprecedented.
In short, Americans are fed up. This election wasn’t just a vote of no confidence in Democrats; it was yet another vote of no confidence in our entire political system. We cannot mistake this result for an active embrace of Trump or MAGA fascism.
Michael Podhorzer is former political director of the AFL-CIO. Senior fellow at the Center for American Progress. Founder: Analyst Institute, Research Collaborative (RC). He publishes Weekend Reading. (weekendreading.net)
Weekend Reading is edited by Emily Crockett, with research assistance by Andrea Evans and Thomas Mande.
1 According to VoteCast data, 40 percent of those voting in 2024 had voted for Biden in 2020, and 40 percent had voted for Trump. 40 percent of 155 million ballots cast in 2024 = 62 million Biden voters. Those 62 million are 19 million less than voted for Biden in 2020. Of course, we’ll have no way of knowing exactly how accurate the VoteCast estimate is until all of the voter files are updated, sometime in March. However, since I wrote How Trump “Won,” voter files in 18 states representing about a third of all votes cast, report that 83 percent of those voting in 2024 voted in 2020, just one point more than VoteCast’s estimate of 82 percent. (AZ, CO, DE, GA, IA, LA, MI, MT, NC, ND, NE, NJ, NV, OH, OK, RI, WA and WI)
2 If you read How Trump “Won,” you know that I think that we are much better served by looking at election results through the framework of what I call 3D-Land, in which Trump received the support of 32 percent of eligible voters, Harris received 31 percent, and 37 percent did not cast ballots. (As opposed to what I called Flatland – the way results are universally reported, as a share of either all votes cast or as a percentage of votes cast for the two parties. That produces the more familiar 49.8 to 48.3 result (all votes) or 50.8 to 49.2 (two-party)).
By definition, there is no 3D-Land in polling. First, at the theoretical level, not voting and not taking a survey are two different things. When someone takes a survey, they do not know that they will be asked their approval of the president in the way that someone deciding whether to vote knows that they are casting a ballot for president.
Second, election results are a census of people who voted. Surveys are a weighted combination of results. In an election, everyone counts as 1, while in a survey, whether your opinion counts as more or less than 1 depends on whether you belong to a demographically defined category that the pollster thinks is under or over represented in the interviews they collected.
Third, we know that those taking surveys are much more likely to have strong opinions than those who don’t, which makes common sense and is routinely validated. That’s especially true for online surveys where respondents regularly take surveys. When I was at the AFL-CIO, when we did online surveys of the general public, we added a question of how many surveys you had taken in the last six months, and found that for a substantial portion of the sample, that was a dozen or more. (This is a serious flaw in online surveys about issues, etc., but that’s for another time.)
All of which is why it’s important that this exercise is about comparing across time rather than trying to get a precise measure of something today. In other words, after that long windup, I hope you can see that while knowing the exact percentage of the population receptive to Trump is elusive and easily debatable, that it is so much less than previous presidents at this point in their term is not remotely debatable. (This is also why, for newer readers, at Weekend Reading you won’t find tables of numbers, but visualizations, wherever possible. I do that because it’s usually the case that if a point can’t be made through visualizations, it’s likely that asserted differences depend on debatable assumptions or methodological margins of error. Estimates presented numerically, especially if they have a decimal point, unconsciously convey unsubstantiated precision.)

