| From | Center for Jobs and the Economy <[email protected]> |
| Subject | California Trade Report for December 2024 |
| Date | February 5, 2025 11:32 PM |
Links have been removed from this email. Learn more in the FAQ.
Links have been removed from this email. Learn more in the FAQ.
Web Version [link removed] | Update Preferences [link removed] [link removed] California Trade Report
for December 2024
Below are highlights from the recently released trade data from the US Census Bureau and US Bureau of Economic Analysis. To view additional data and analysis related to the California economy visit our website at www.centerforjobs.org/ca [[link removed]].
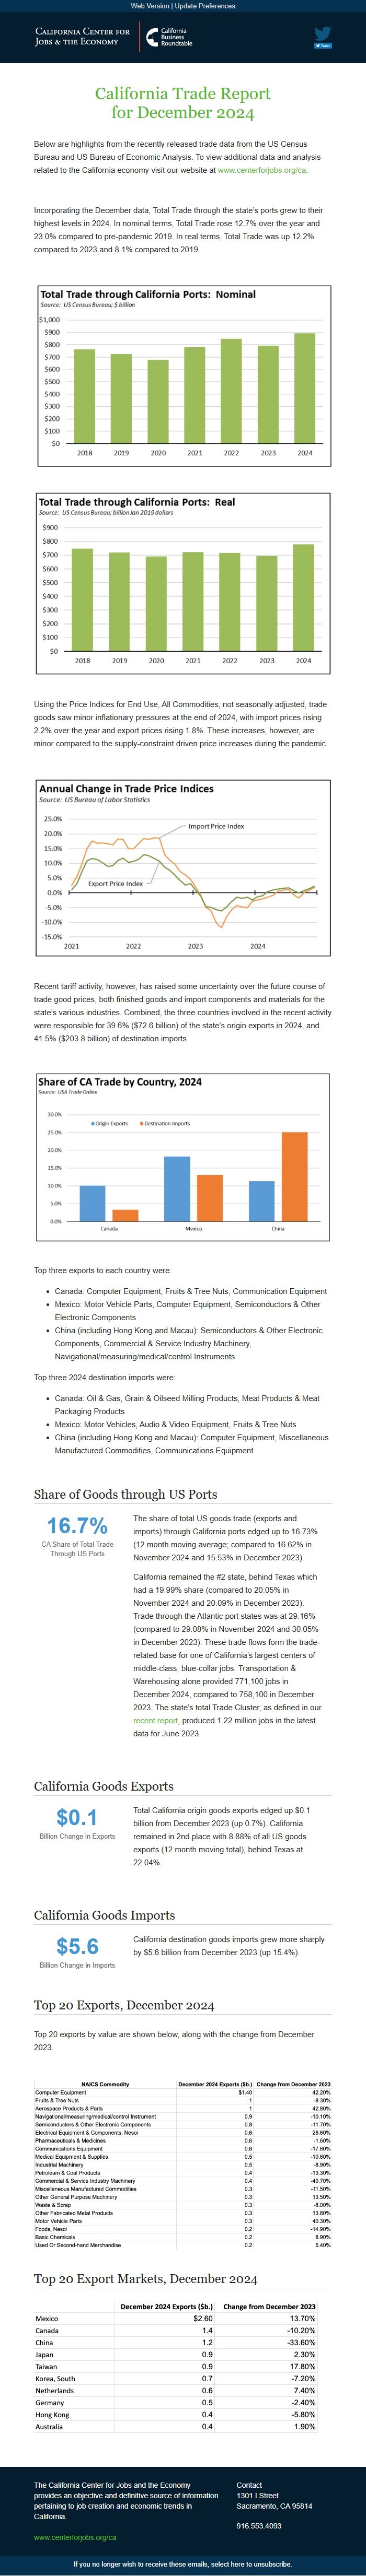
Incorporating the December data, Total Trade through the state’s ports grew to their highest levels in 2024. In nominal terms, Total Trade rose 12.7% over the year and 23.0% compared to pre-pandemic 2019. In real terms, Total Trade was up 12.2% compared to 2023 and 8.1% compared to 2019.
Using the Price Indices for End Use, All Commodities, not seasonally adjusted, trade goods saw minor inflationary pressures at the end of 2024, with import prices rising 2.2% over the year and export prices rising 1.8%. These increases, however, are minor compared to the supply-constraint driven price increases during the pandemic.
Recent tariff activity, however, has raised some uncertainty over the future course of trade good prices, both finished goods and import components and materials for the state’s various industries. Combined, the three countries involved in the recent activity were responsible for 39.6% ($72.6 billion) of the state’s origin exports in 2024, and 41.5% ($203.8 billion) of destination imports.
Top three exports to each country were:
Canada: Computer Equipment, Fruits & Tree Nuts, Communication Equipment Mexico: Motor Vehicle Parts, Computer Equipment, Semiconductors & Other Electronic Components China (including Hong Kong and Macau): Semiconductors & Other Electronic Components, Commercial & Service Industry Machinery, Navigational/measuring/medical/control Instruments
Top three 2024 destination imports were:
Canada: Oil & Gas, Grain & Oilseed Milling Products, Meat Products & Meat Packaging Products Mexico: Motor Vehicles, Audio & Video Equipment, Fruits & Tree Nuts China (including Hong Kong and Macau): Computer Equipment, Miscellaneous Manufactured Commodities, Communications Equipment Share of Goods through US Ports 16.7% CA Share of Total Trade Through US Ports
The share of total US goods trade (exports and imports) through California ports edged up to 16.73% (12 month moving average; compared to 16.62% in November 2024 and 15.53% in December 2023).
California remained the #2 state, behind Texas which had a 19.99% share (compared to 20.05% in November 2024 and 20.09% in December 2023). Trade through the Atlantic port states was at 29.16% (compared to 29.08% in November 2024 and 30.05% in December 2023). These trade flows form the trade-related base for one of California’s largest centers of middle-class, blue-collar jobs. Transportation & Warehousing alone provided 771,100 jobs in December 2024, compared to 758,100 in December 2023. The state’s total Trade Cluster, as defined in our recent report [[link removed]], produced 1.22 million jobs in the latest data for June 2023.
California Goods Exports $0.1 Billion Change in Exports
Total California origin goods exports edged up $0.1 billion from December 2023 (up 0.7%). California remained in 2nd place with 8.88% of all US goods exports (12 month moving total), behind Texas at 22.04%.
California Goods Imports $5.6 Billion Change in Imports
California destination goods imports grew more sharply by $5.6 billion from December 2023 (up 15.4%).
Top 20 Exports, December 2024
Top 20 exports by value are shown below, along with the change from December 2023.
Top 20 Export Markets, December 2024 The California Center for Jobs and the Economy provides an objective and definitive source of information pertaining to job creation and economic trends in California. [[link removed]] Contact 1301 I Street Sacramento, CA 95814 916.553.4093 If you no longer wish to receive these emails, select here to unsubscribe. [link removed]
for December 2024
Below are highlights from the recently released trade data from the US Census Bureau and US Bureau of Economic Analysis. To view additional data and analysis related to the California economy visit our website at www.centerforjobs.org/ca [[link removed]].
Incorporating the December data, Total Trade through the state’s ports grew to their highest levels in 2024. In nominal terms, Total Trade rose 12.7% over the year and 23.0% compared to pre-pandemic 2019. In real terms, Total Trade was up 12.2% compared to 2023 and 8.1% compared to 2019.
Using the Price Indices for End Use, All Commodities, not seasonally adjusted, trade goods saw minor inflationary pressures at the end of 2024, with import prices rising 2.2% over the year and export prices rising 1.8%. These increases, however, are minor compared to the supply-constraint driven price increases during the pandemic.
Recent tariff activity, however, has raised some uncertainty over the future course of trade good prices, both finished goods and import components and materials for the state’s various industries. Combined, the three countries involved in the recent activity were responsible for 39.6% ($72.6 billion) of the state’s origin exports in 2024, and 41.5% ($203.8 billion) of destination imports.
Top three exports to each country were:
Canada: Computer Equipment, Fruits & Tree Nuts, Communication Equipment Mexico: Motor Vehicle Parts, Computer Equipment, Semiconductors & Other Electronic Components China (including Hong Kong and Macau): Semiconductors & Other Electronic Components, Commercial & Service Industry Machinery, Navigational/measuring/medical/control Instruments
Top three 2024 destination imports were:
Canada: Oil & Gas, Grain & Oilseed Milling Products, Meat Products & Meat Packaging Products Mexico: Motor Vehicles, Audio & Video Equipment, Fruits & Tree Nuts China (including Hong Kong and Macau): Computer Equipment, Miscellaneous Manufactured Commodities, Communications Equipment Share of Goods through US Ports 16.7% CA Share of Total Trade Through US Ports
The share of total US goods trade (exports and imports) through California ports edged up to 16.73% (12 month moving average; compared to 16.62% in November 2024 and 15.53% in December 2023).
California remained the #2 state, behind Texas which had a 19.99% share (compared to 20.05% in November 2024 and 20.09% in December 2023). Trade through the Atlantic port states was at 29.16% (compared to 29.08% in November 2024 and 30.05% in December 2023). These trade flows form the trade-related base for one of California’s largest centers of middle-class, blue-collar jobs. Transportation & Warehousing alone provided 771,100 jobs in December 2024, compared to 758,100 in December 2023. The state’s total Trade Cluster, as defined in our recent report [[link removed]], produced 1.22 million jobs in the latest data for June 2023.
California Goods Exports $0.1 Billion Change in Exports
Total California origin goods exports edged up $0.1 billion from December 2023 (up 0.7%). California remained in 2nd place with 8.88% of all US goods exports (12 month moving total), behind Texas at 22.04%.
California Goods Imports $5.6 Billion Change in Imports
California destination goods imports grew more sharply by $5.6 billion from December 2023 (up 15.4%).
Top 20 Exports, December 2024
Top 20 exports by value are shown below, along with the change from December 2023.
Top 20 Export Markets, December 2024 The California Center for Jobs and the Economy provides an objective and definitive source of information pertaining to job creation and economic trends in California. [[link removed]] Contact 1301 I Street Sacramento, CA 95814 916.553.4093 If you no longer wish to receive these emails, select here to unsubscribe. [link removed]
Message Analysis
- Sender: California Center for Jobs and the Economy
- Political Party: n/a
- Country: United States
- State/Locality: California
- Office: n/a
-
Email Providers:
- Campaign Monitor