Jump into January with Free Data-Filled Resources for the Classroom!
Happy New Year! In celebration of this month’s observances, begin 2025 exploring Statistics in Schools (SIS) resources to find interesting things about America’s population. From how many people use a desktop or laptop versus a tablet to finding data to help you open or expand a business, the SIS program has a plethora of fun activities and resources full of data gathered from the U.S. Census Bureau for grades K-12 that will enhance your students’ statistical and civic literacy skills.
National Trivia Day – January 4
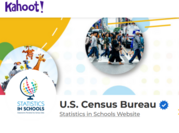
Celebrate this day using the Census Bureau’s Kahoot! collection of games that improve and test students’ knowledge using real-life data about things like population, American history, U.S. businesses, education, U.S. sports and more. Students can explore interesting topics like the average annual salary of workers with a bachelor’s degree, the percentage of boys and girls who participated in sports-related activities, and the top three states with the most chocolate makers. Who will come in first, second, and third?
|
Martin Luther King Jr. Day – January 20

Did you know that the percentage of Black or African American adults with a four-year college degree increased by about 24 percent from 1964 to 2020? Celebrate this day with elementary school students by having them complete our history activity, I Have a Dream – Learning About Martin Luther King Jr., which includes key statistics like this and others such as changes in the U.S. population, voting rates, and education levels of Americans since the early 1960s when Dr. Martin Luther King Jr. delivered his “I Have a Dream” speech.
|
National Puzzle Day – January 29

Happy National Puzzle Day! In honor of this day, share our Census Word Find and Crossword Warm-Up Activities with your students to teach them about Census Bureau data and help expand their vocabulary of census-related terms like population, education, survey, statistics, and more!
|
Activity of the Month
SIS has a variety of standards-based activities for all grade levels. In this section of our newsletter, an SIS staff member has handpicked one of their favorites for you to explore.
Changes in My State
In this activity, students will learn about their state as they collect and organize business information using State Facts for Students, a U.S. Census Bureau data tool. Students can examine data about kids their age, as well as a variety of other facts selected to appeal to young students. Students will create a bar graph to represent how the numbers of selected business types have changed between 2010 and 2022.
|
Why is this activity a staff favorite?
Students will use a fun data tool where they can discover fun facts like how many pet and pet supplies stores there are in their state. They can even compare the number of candy and nut stores to the number of dentist offices. For example, in 2010 there were 129,830 U.S. dentist offices compared to 136,140 in 2022. And the number of U.S. candy and nut stores in 2010 was 3,365 compared to 3,399 in 2022.
This elementary school activity teaches students that a good way to compare data is to represent those data in a bar graph. They choose business types such as amusement parks, ice cream and frozen dessert makers, or zoos and botanical gardens from the State Facts for Students data tool to compare the numbers in their state in 2010 and 2022. Not only do students create a bar graph with the data they collect, but they also reflect upon their findings by answering questions such as what surprised them about the differences in the numbers of business types and which ones experienced the greatest increase or decrease? With encouragement from their teachers, students will see that there are many ways of answering one question, demonstrating how bar graphs highlight these different answers that may not have been as apparent in the raw numerical data. Developing the skill of creating bar graphs helps to showcase data in a more visual, fun way!
Plan ahead. Check out our resources for African American (Black) History Month (February ), Valentine’s Day (February 14), Presidents’ Day (February 17), Digital Learning Day (February 13), and Public Schools Week (February 24–28). Use our Monthly Highlights page to plan your month.
|