| From | Center for Jobs and the Economy <[email protected]> |
| Subject | California Trade Report for March 2020 |
| Date | May 5, 2020 8:00 PM |
Links have been removed from this email. Learn more in the FAQ.
Links have been removed from this email. Learn more in the FAQ.
Web Version [link removed] | Update Preferences [link removed] [link removed] California Trade Report
for March 2020
Below are highlights from the recently released trade data from the US Census Bureau and US Bureau of Economic Analysis. To view additional data and analysis related to the California economy visit our website at [[link removed]].
The March data continues to reflect the downturn in the economy stemming from the global supply disruptions that began with the closures in China. As shown in the table below, goods trade with China, Hong Kong, and Macau through the state’s ports was down 34% from the year earlier, with the deepest slump in imports.
Share of Goods through US Ports 17.2% CA Share of Total Trade Through US Ports
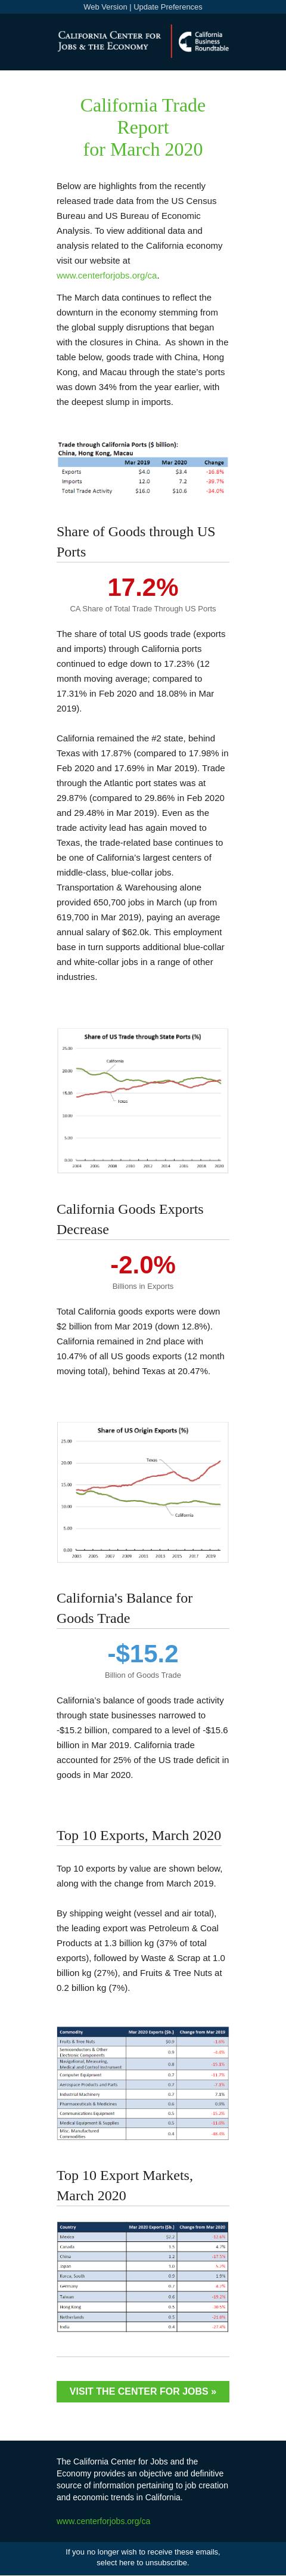
The share of total US goods trade (exports and imports) through California ports continued to edge down to 17.23% (12 month moving average; compared to 17.31% in Feb 2020 and 18.08% in Mar 2019).
California remained the #2 state, behind Texas with 17.87% (compared to 17.98% in Feb 2020 and 17.69% in Mar 2019). Trade through the Atlantic port states was at 29.87% (compared to 29.86% in Feb 2020 and 29.48% in Mar 2019). Even as the trade activity lead has again moved to Texas, the trade-related base continues to be one of California’s largest centers of middle-class, blue-collar jobs. Transportation & Warehousing alone provided 650,700 jobs in March (up from 619,700 in Mar 2019), paying an average annual salary of $62.0k. This employment base in turn supports additional blue-collar and white-collar jobs in a range of other industries.
California Goods Exports Decrease -2.0% Billions in Exports
Total California goods exports were down $2 billion from Mar 2019 (down 12.8%). California remained in 2nd place with 10.47% of all US goods exports (12 month moving total), behind Texas at 20.47%.
California's Balance for Goods Trade -$15.2 Billion of Goods Trade
California’s balance of goods trade activity through state businesses narrowed to -$15.2 billion, compared to a level of -$15.6 billion in Mar 2019. California trade accounted for 25% of the US trade deficit in goods in Mar 2020.
Top 10 Exports, March 2020
Top 10 exports by value are shown below, along with the change from March 2019.
By shipping weight (vessel and air total), the leading export was Petroleum & Coal Products at 1.3 billion kg (37% of total exports), followed by Waste & Scrap at 1.0 billion kg (27%), and Fruits & Tree Nuts at 0.2 billion kg (7%).
Top 10 Export Markets, March 2020 Visit the center for jobs » [[link removed]] The California Center for Jobs and the Economy provides an objective and definitive source of information pertaining to job creation and economic trends in California. [[link removed]] Contact 1301 I Street Sacramento, CA 95814 916.553.4093 If you no longer wish to receive these emails, select here to unsubscribe. [link removed]
for March 2020
Below are highlights from the recently released trade data from the US Census Bureau and US Bureau of Economic Analysis. To view additional data and analysis related to the California economy visit our website at [[link removed]].
The March data continues to reflect the downturn in the economy stemming from the global supply disruptions that began with the closures in China. As shown in the table below, goods trade with China, Hong Kong, and Macau through the state’s ports was down 34% from the year earlier, with the deepest slump in imports.
Share of Goods through US Ports 17.2% CA Share of Total Trade Through US Ports
The share of total US goods trade (exports and imports) through California ports continued to edge down to 17.23% (12 month moving average; compared to 17.31% in Feb 2020 and 18.08% in Mar 2019).
California remained the #2 state, behind Texas with 17.87% (compared to 17.98% in Feb 2020 and 17.69% in Mar 2019). Trade through the Atlantic port states was at 29.87% (compared to 29.86% in Feb 2020 and 29.48% in Mar 2019). Even as the trade activity lead has again moved to Texas, the trade-related base continues to be one of California’s largest centers of middle-class, blue-collar jobs. Transportation & Warehousing alone provided 650,700 jobs in March (up from 619,700 in Mar 2019), paying an average annual salary of $62.0k. This employment base in turn supports additional blue-collar and white-collar jobs in a range of other industries.
California Goods Exports Decrease -2.0% Billions in Exports
Total California goods exports were down $2 billion from Mar 2019 (down 12.8%). California remained in 2nd place with 10.47% of all US goods exports (12 month moving total), behind Texas at 20.47%.
California's Balance for Goods Trade -$15.2 Billion of Goods Trade
California’s balance of goods trade activity through state businesses narrowed to -$15.2 billion, compared to a level of -$15.6 billion in Mar 2019. California trade accounted for 25% of the US trade deficit in goods in Mar 2020.
Top 10 Exports, March 2020
Top 10 exports by value are shown below, along with the change from March 2019.
By shipping weight (vessel and air total), the leading export was Petroleum & Coal Products at 1.3 billion kg (37% of total exports), followed by Waste & Scrap at 1.0 billion kg (27%), and Fruits & Tree Nuts at 0.2 billion kg (7%).
Top 10 Export Markets, March 2020 Visit the center for jobs » [[link removed]] The California Center for Jobs and the Economy provides an objective and definitive source of information pertaining to job creation and economic trends in California. [[link removed]] Contact 1301 I Street Sacramento, CA 95814 916.553.4093 If you no longer wish to receive these emails, select here to unsubscribe. [link removed]
Message Analysis
- Sender: California Center for Jobs and the Economy
- Political Party: n/a
- Country: United States
- State/Locality: California
- Office: n/a
-
Email Providers:
- Campaign Monitor