| From | Center for Jobs and the Economy <[email protected]> |
| Subject | California Trade Report for July 2024 |
| Date | September 6, 2024 4:11 PM |
Links have been removed from this email. Learn more in the FAQ.
Links have been removed from this email. Learn more in the FAQ.
Web Version [link removed] | Update Preferences [link removed] [link removed] California Trade Report
for July 2024
Below are highlights from the recently released trade data from the US Census Bureau and US Bureau of Economic Analysis. To view additional data and analysis related to the California economy visit our website at www.centerforjobs.org/ca.
Trade Growth Driven by Imports
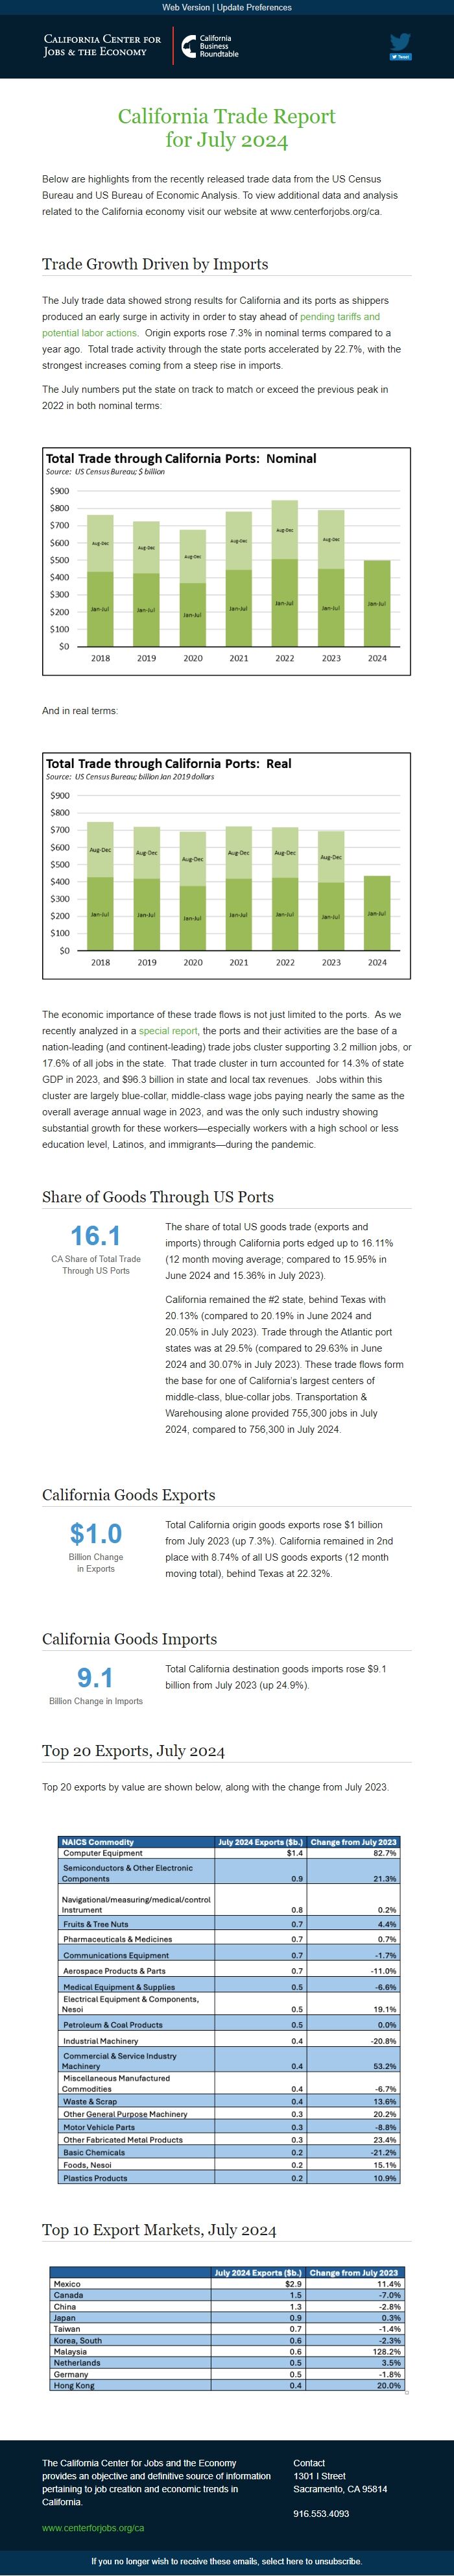
The July trade data showed strong results for California and its ports as shippers produced an early surge in activity in order to stay ahead of pending tariffs and potential labor actions [[link removed]]. Origin exports rose 7.3% in nominal terms compared to a year ago. Total trade activity through the state ports accelerated by 22.7%, with the strongest increases coming from a steep rise in imports.
The July numbers put the state on track to match or exceed the previous peak in 2022 in both nominal terms:
And in real terms:
The economic importance of these trade flows is not just limited to the ports. As we recently analyzed in a special report [[link removed]], the ports and their activities are the base of a nation-leading (and continent-leading) trade jobs cluster supporting 3.2 million jobs, or 17.6% of all jobs in the state. That trade cluster in turn accounted for 14.3% of state GDP in 2023, and $96.3 billion in state and local tax revenues. Jobs within this cluster are largely blue-collar, middle-class wage jobs paying nearly the same as the overall average annual wage in 2023, and was the only such industry showing substantial growth for these workers—especially workers with a high school or less education level, Latinos, and immigrants—during the pandemic.
Share of Goods Through US Ports 16.1 CA Share of Total Trade
Through US Ports
The share of total US goods trade (exports and imports) through California ports edged up to 16.11% (12 month moving average; compared to 15.95% in June 2024 and 15.36% in July 2023).
California remained the #2 state, behind Texas with 20.13% (compared to 20.19% in June 2024 and 20.05% in July 2023). Trade through the Atlantic port states was at 29.5% (compared to 29.63% in June 2024 and 30.07% in July 2023). These trade flows form the base for one of California’s largest centers of middle-class, blue-collar jobs. Transportation & Warehousing alone provided 755,300 jobs in July 2024, compared to 756,300 in July 2024.
California Goods Exports $1.0 Billion Change
in Exports
Total California origin goods exports rose $1 billion from July 2023 (up 7.3%). California remained in 2nd place with 8.74% of all US goods exports (12 month moving total), behind Texas at 22.32%.
California Goods Imports 9.1 Billion Change in Imports
Total California destination goods imports rose $9.1 billion from July 2023 (up 24.9%).
Top 20 Exports, July 2024
Top 20 exports by value are shown below, along with the change from July 2023.
Top 10 Export Markets, July 2024 The California Center for Jobs and the Economy provides an objective and definitive source of information pertaining to job creation and economic trends in California. [[link removed]] Contact 1301 I Street Sacramento, CA 95814 916.553.4093 If you no longer wish to receive these emails, select here to unsubscribe. [link removed]
for July 2024
Below are highlights from the recently released trade data from the US Census Bureau and US Bureau of Economic Analysis. To view additional data and analysis related to the California economy visit our website at www.centerforjobs.org/ca.
Trade Growth Driven by Imports
The July trade data showed strong results for California and its ports as shippers produced an early surge in activity in order to stay ahead of pending tariffs and potential labor actions [[link removed]]. Origin exports rose 7.3% in nominal terms compared to a year ago. Total trade activity through the state ports accelerated by 22.7%, with the strongest increases coming from a steep rise in imports.
The July numbers put the state on track to match or exceed the previous peak in 2022 in both nominal terms:
And in real terms:
The economic importance of these trade flows is not just limited to the ports. As we recently analyzed in a special report [[link removed]], the ports and their activities are the base of a nation-leading (and continent-leading) trade jobs cluster supporting 3.2 million jobs, or 17.6% of all jobs in the state. That trade cluster in turn accounted for 14.3% of state GDP in 2023, and $96.3 billion in state and local tax revenues. Jobs within this cluster are largely blue-collar, middle-class wage jobs paying nearly the same as the overall average annual wage in 2023, and was the only such industry showing substantial growth for these workers—especially workers with a high school or less education level, Latinos, and immigrants—during the pandemic.
Share of Goods Through US Ports 16.1 CA Share of Total Trade
Through US Ports
The share of total US goods trade (exports and imports) through California ports edged up to 16.11% (12 month moving average; compared to 15.95% in June 2024 and 15.36% in July 2023).
California remained the #2 state, behind Texas with 20.13% (compared to 20.19% in June 2024 and 20.05% in July 2023). Trade through the Atlantic port states was at 29.5% (compared to 29.63% in June 2024 and 30.07% in July 2023). These trade flows form the base for one of California’s largest centers of middle-class, blue-collar jobs. Transportation & Warehousing alone provided 755,300 jobs in July 2024, compared to 756,300 in July 2024.
California Goods Exports $1.0 Billion Change
in Exports
Total California origin goods exports rose $1 billion from July 2023 (up 7.3%). California remained in 2nd place with 8.74% of all US goods exports (12 month moving total), behind Texas at 22.32%.
California Goods Imports 9.1 Billion Change in Imports
Total California destination goods imports rose $9.1 billion from July 2023 (up 24.9%).
Top 20 Exports, July 2024
Top 20 exports by value are shown below, along with the change from July 2023.
Top 10 Export Markets, July 2024 The California Center for Jobs and the Economy provides an objective and definitive source of information pertaining to job creation and economic trends in California. [[link removed]] Contact 1301 I Street Sacramento, CA 95814 916.553.4093 If you no longer wish to receive these emails, select here to unsubscribe. [link removed]
Message Analysis
- Sender: California Center for Jobs and the Economy
- Political Party: n/a
- Country: United States
- State/Locality: California
- Office: n/a
-
Email Providers:
- Campaign Monitor