| From | Center for Jobs and the Economy <[email protected]> |
| Subject | California Trade Report for March 2024 |
| Date | May 2, 2024 11:00 PM |
Links have been removed from this email. Learn more in the FAQ.
Links have been removed from this email. Learn more in the FAQ.
Web Version [link removed] | Update Preferences [link removed] [link removed] California Trade Report
for March 2024
Below are highlights from the recently released trade data from the US Census Bureau and US Bureau of Economic Analysis. To view additional data and analysis related to the California economy visit our website at [[link removed]].
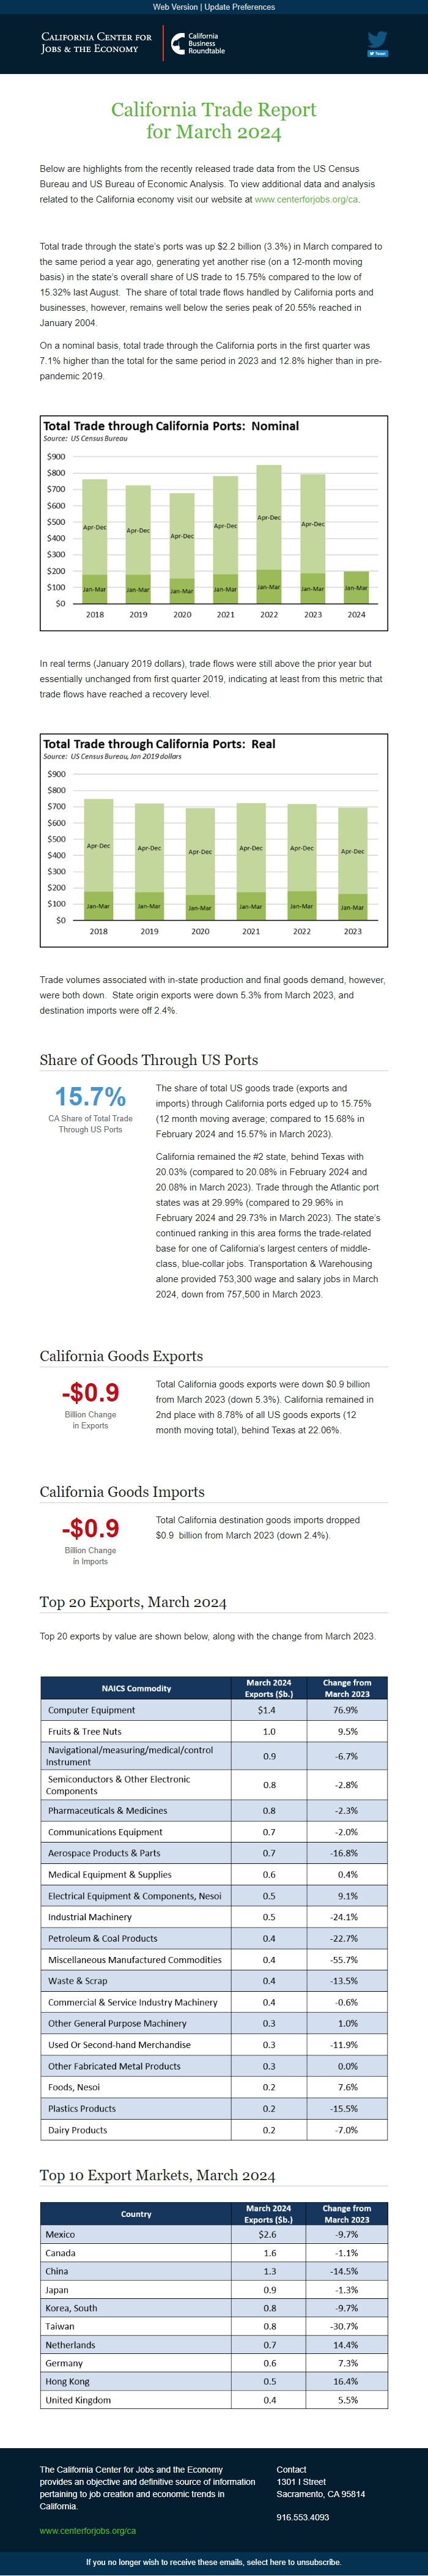
Total trade through the state’s ports was up $2.2 billion (3.3%) in March compared to the same period a year ago, generating yet another rise (on a 12-month moving basis) in the state’s overall share of US trade to 15.75% compared to the low of 15.32% last August. The share of total trade flows handled by California ports and businesses, however, remains well below the series peak of 20.55% reached in January 2004.
On a nominal basis, total trade through the California ports in the first quarter was 7.1% higher than the total for the same period in 2023 and 12.8% higher than in pre-pandemic 2019.
In real terms (January 2019 dollars), trade flows were still above the prior year but essentially unchanged from first quarter 2019, indicating at least from this metric that trade flows have reached a recovery level.
Trade volumes associated with in-state production and final goods demand, however, were both down. State origin exports were down 5.3% from March 2023, and destination imports were off 2.4%.
Share of Goods Through US Ports 15.7% CA Share of Total Trade
Through US Ports
The share of total US goods trade (exports and imports) through California ports edged up to 15.75% (12 month moving average; compared to 15.68% in February 2024 and 15.57% in March 2023).
California remained the #2 state, behind Texas with 20.03% (compared to 20.08% in February 2024 and 20.08% in March 2023). Trade through the Atlantic port states was at 29.99% (compared to 29.96% in February 2024 and 29.73% in March 2023). The state’s continued ranking in this area forms the trade-related base for one of California’s largest centers of middle-class, blue-collar jobs. Transportation & Warehousing alone provided 753,300 wage and salary jobs in March 2024, down from 757,500 in March 2023.
California Goods Exports -$0.9 Billion Change
in Exports
Total California goods exports were down $0.9 billion from March 2023 (down 5.3%). California remained in 2nd place with 8.78% of all US goods exports (12 month moving total), behind Texas at 22.06%.
California Goods Imports -$0.9 Billion Change
in Imports
Total California destination goods imports dropped $0.9 billion from March 2023 (down 2.4%).
Top 20 Exports, March 2024
Top 20 exports by value are shown below, along with the change from March 2023.
Top 10 Export Markets, March 2024 The California Center for Jobs and the Economy provides an objective and definitive source of information pertaining to job creation and economic trends in California. [[link removed]] Contact 1301 I Street Sacramento, CA 95814 916.553.4093 If you no longer wish to receive these emails, select here to unsubscribe. [link removed]
for March 2024
Below are highlights from the recently released trade data from the US Census Bureau and US Bureau of Economic Analysis. To view additional data and analysis related to the California economy visit our website at [[link removed]].
Total trade through the state’s ports was up $2.2 billion (3.3%) in March compared to the same period a year ago, generating yet another rise (on a 12-month moving basis) in the state’s overall share of US trade to 15.75% compared to the low of 15.32% last August. The share of total trade flows handled by California ports and businesses, however, remains well below the series peak of 20.55% reached in January 2004.
On a nominal basis, total trade through the California ports in the first quarter was 7.1% higher than the total for the same period in 2023 and 12.8% higher than in pre-pandemic 2019.
In real terms (January 2019 dollars), trade flows were still above the prior year but essentially unchanged from first quarter 2019, indicating at least from this metric that trade flows have reached a recovery level.
Trade volumes associated with in-state production and final goods demand, however, were both down. State origin exports were down 5.3% from March 2023, and destination imports were off 2.4%.
Share of Goods Through US Ports 15.7% CA Share of Total Trade
Through US Ports
The share of total US goods trade (exports and imports) through California ports edged up to 15.75% (12 month moving average; compared to 15.68% in February 2024 and 15.57% in March 2023).
California remained the #2 state, behind Texas with 20.03% (compared to 20.08% in February 2024 and 20.08% in March 2023). Trade through the Atlantic port states was at 29.99% (compared to 29.96% in February 2024 and 29.73% in March 2023). The state’s continued ranking in this area forms the trade-related base for one of California’s largest centers of middle-class, blue-collar jobs. Transportation & Warehousing alone provided 753,300 wage and salary jobs in March 2024, down from 757,500 in March 2023.
California Goods Exports -$0.9 Billion Change
in Exports
Total California goods exports were down $0.9 billion from March 2023 (down 5.3%). California remained in 2nd place with 8.78% of all US goods exports (12 month moving total), behind Texas at 22.06%.
California Goods Imports -$0.9 Billion Change
in Imports
Total California destination goods imports dropped $0.9 billion from March 2023 (down 2.4%).
Top 20 Exports, March 2024
Top 20 exports by value are shown below, along with the change from March 2023.
Top 10 Export Markets, March 2024 The California Center for Jobs and the Economy provides an objective and definitive source of information pertaining to job creation and economic trends in California. [[link removed]] Contact 1301 I Street Sacramento, CA 95814 916.553.4093 If you no longer wish to receive these emails, select here to unsubscribe. [link removed]
Message Analysis
- Sender: California Center for Jobs and the Economy
- Political Party: n/a
- Country: United States
- State/Locality: California
- Office: n/a
-
Email Providers:
- Campaign Monitor