| From | Center for Jobs and the Economy <[email protected]> |
| Subject | California Energy Price Data for March 2024 |
| Date | April 6, 2024 12:29 AM |
Links have been removed from this email. Learn more in the FAQ.
Links have been removed from this email. Learn more in the FAQ.
Web Version [link removed] | Update Preferences [link removed] [link removed] California Energy Price Data
March 2024
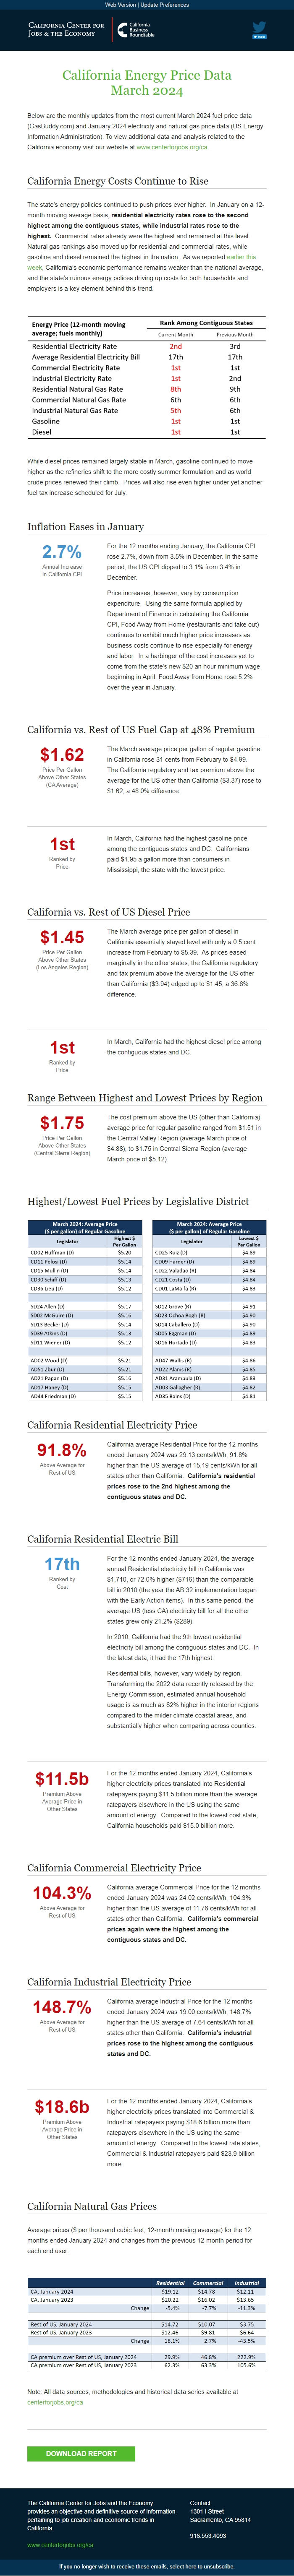
Below are the monthly updates from the most current March 2024 fuel price data (GasBuddy.com) and January 2024 electricity and natural gas price data (US Energy Information Administration). To view additional data and analysis related to the California economy visit our website at www.centerforjobs.org/ca. [[link removed]]
California Energy Costs Continue to Rise
The state’s energy policies continued to push prices ever higher. In January on a 12-month moving average basis, residential electricity rates rose to the second highest among the contiguous states, while industrial rates rose to the highest. Commercial rates already were the highest and remained at this level. Natural gas rankings also moved up for residential and commercial rates, while gasoline and diesel remained the highest in the nation. As we reported earlier this week [[link removed]], California’s economic performance remains weaker than the national average, and the state’s ruinous energy polices driving up costs for both households and employers is a key element behind this trend.
While diesel prices remained largely stable in March, gasoline continued to move higher as the refineries shift to the more costly summer formulation and as world crude prices renewed their climb. Prices will also rise even higher under yet another fuel tax increase scheduled for July.
Inflation Eases in January 2.7% Annual Increase
in California CPI
For the 12 months ending January, the California CPI rose 2.7%, down from 3.5% in December. In the same period, the US CPI dipped to 3.1% from 3.4% in December.
Price increases, however, vary by consumption expenditure. Using the same formula applied by Department of Finance in calculating the California CPI, Food Away from Home (restaurants and take out) continues to exhibit much higher price increases as business costs continue to rise especially for energy and labor. In a harbinger of the cost increases yet to come from the state’s new $20 an hour minimum wage beginning in April, Food Away from Home rose 5.2% over the year in January.
California vs. Rest of US Fuel Gap at 48% Premium $1.62 Price Per Gallon
Above Other States
(CA Average)
The March average price per gallon of regular gasoline in California rose 31 cents from February to $4.99. The California regulatory and tax premium above the average for the US other than California ($3.37) rose to $1.62, a 48.0% difference.
1st Ranked by
Price
In March, California had the highest gasoline price among the contiguous states and DC. Californians paid $1.95 a gallon more than consumers in Mississippi, the state with the lowest price.
California vs. Rest of US Diesel Price $1.45 Price Per Gallon
Above Other States
(Los Angeles Region)
The March average price per gallon of diesel in California essentially stayed level with only a 0.5 cent increase from February to $5.39. As prices eased marginally in the other states, the California regulatory and tax premium above the average for the US other than California ($3.94) edged up to $1.45, a 36.8% difference.
1st Ranked by
Price
In March, California had the highest diesel price among the contiguous states and DC.
Range Between Highest and Lowest Prices by Region $1.75 Price Per Gallon
Above Other States
(Central Sierra Region)
The cost premium above the US (other than California) average price for regular gasoline ranged from $1.51 in the Central Valley Region (average March price of $4.88), to $1.75 in Central Sierra Region (average March price of $5.12).
Highest/Lowest Fuel Prices by Legislative District California Residential Electricity Price 91.8% Above Average for
Rest of US
California average Residential Price for the 12 months ended January 2024 was 29.13 cents/kWh, 91.8% higher than the US average of 15.19 cents/kWh for all states other than California. California's residential prices rose to the 2nd highest among the contiguous states and DC.
California Residential Electric Bill 17th Ranked by
Cost
For the 12 months ended January 2024, the average annual Residential electricity bill in California was $1,710, or 72.0% higher ($716) than the comparable bill in 2010 (the year the AB 32 implementation began with the Early Action items). In this same period, the average US (less CA) electricity bill for all the other states grew only 21.2% ($289).
In 2010, California had the 9th lowest residential electricity bill among the contiguous states and DC. In the latest data, it had the 17th highest.
Residential bills, however, vary widely by region. Transforming the 2022 data recently released by the Energy Commission, estimated annual household usage is as much as 82% higher in the interior regions compared to the milder climate coastal areas, and substantially higher when comparing across counties.
$11.5b Premium Above
Average Price in
Other States
For the 12 months ended January 2024, California's higher electricity prices translated into Residential ratepayers paying $11.5 billion more than the average ratepayers elsewhere in the US using the same amount of energy. Compared to the lowest cost state, California households paid $15.0 billion more.
California Commercial Electricity Price 104.3% Above Average for
Rest of US
California average Commercial Price for the 12 months ended January 2024 was 24.02 cents/kWh, 104.3% higher than the US average of 11.76 cents/kWh for all states other than California. California's commercial prices again were the highest among the contiguous states and DC.
California Industrial Electricity Price 148.7% Above Average for
Rest of US
California average Industrial Price for the 12 months ended January 2024 was 19.00 cents/kWh, 148.7% higher than the US average of 7.64 cents/kWh for all states other than California. California's industrial prices rose to the highest among the contiguous states and DC.
$18.6b Premium Above
Average Price in
Other States
For the 12 months ended January 2024, California's higher electricity prices translated into Commercial & Industrial ratepayers paying $18.6 billion more than ratepayers elsewhere in the US using the same amount of energy. Compared to the lowest rate states, Commercial & Industrial ratepayers paid $23.9 billion more.
California Natural Gas Prices
Average prices ($ per thousand cubic feet; 12-month moving average) for the 12 months ended January 2024 and changes from the previous 12-month period for each end user:
Note: All data sources, methodologies and historical data series available at [[link removed]]
Download Report [[link removed]] The California Center for Jobs and the Economy provides an objective and definitive source of information pertaining to job creation and economic trends in California. [[link removed]] Contact 1301 I Street Sacramento, CA 95814 916.553.4093 If you no longer wish to receive these emails, select here to unsubscribe. [link removed]
March 2024
Below are the monthly updates from the most current March 2024 fuel price data (GasBuddy.com) and January 2024 electricity and natural gas price data (US Energy Information Administration). To view additional data and analysis related to the California economy visit our website at www.centerforjobs.org/ca. [[link removed]]
California Energy Costs Continue to Rise
The state’s energy policies continued to push prices ever higher. In January on a 12-month moving average basis, residential electricity rates rose to the second highest among the contiguous states, while industrial rates rose to the highest. Commercial rates already were the highest and remained at this level. Natural gas rankings also moved up for residential and commercial rates, while gasoline and diesel remained the highest in the nation. As we reported earlier this week [[link removed]], California’s economic performance remains weaker than the national average, and the state’s ruinous energy polices driving up costs for both households and employers is a key element behind this trend.
While diesel prices remained largely stable in March, gasoline continued to move higher as the refineries shift to the more costly summer formulation and as world crude prices renewed their climb. Prices will also rise even higher under yet another fuel tax increase scheduled for July.
Inflation Eases in January 2.7% Annual Increase
in California CPI
For the 12 months ending January, the California CPI rose 2.7%, down from 3.5% in December. In the same period, the US CPI dipped to 3.1% from 3.4% in December.
Price increases, however, vary by consumption expenditure. Using the same formula applied by Department of Finance in calculating the California CPI, Food Away from Home (restaurants and take out) continues to exhibit much higher price increases as business costs continue to rise especially for energy and labor. In a harbinger of the cost increases yet to come from the state’s new $20 an hour minimum wage beginning in April, Food Away from Home rose 5.2% over the year in January.
California vs. Rest of US Fuel Gap at 48% Premium $1.62 Price Per Gallon
Above Other States
(CA Average)
The March average price per gallon of regular gasoline in California rose 31 cents from February to $4.99. The California regulatory and tax premium above the average for the US other than California ($3.37) rose to $1.62, a 48.0% difference.
1st Ranked by
Price
In March, California had the highest gasoline price among the contiguous states and DC. Californians paid $1.95 a gallon more than consumers in Mississippi, the state with the lowest price.
California vs. Rest of US Diesel Price $1.45 Price Per Gallon
Above Other States
(Los Angeles Region)
The March average price per gallon of diesel in California essentially stayed level with only a 0.5 cent increase from February to $5.39. As prices eased marginally in the other states, the California regulatory and tax premium above the average for the US other than California ($3.94) edged up to $1.45, a 36.8% difference.
1st Ranked by
Price
In March, California had the highest diesel price among the contiguous states and DC.
Range Between Highest and Lowest Prices by Region $1.75 Price Per Gallon
Above Other States
(Central Sierra Region)
The cost premium above the US (other than California) average price for regular gasoline ranged from $1.51 in the Central Valley Region (average March price of $4.88), to $1.75 in Central Sierra Region (average March price of $5.12).
Highest/Lowest Fuel Prices by Legislative District California Residential Electricity Price 91.8% Above Average for
Rest of US
California average Residential Price for the 12 months ended January 2024 was 29.13 cents/kWh, 91.8% higher than the US average of 15.19 cents/kWh for all states other than California. California's residential prices rose to the 2nd highest among the contiguous states and DC.
California Residential Electric Bill 17th Ranked by
Cost
For the 12 months ended January 2024, the average annual Residential electricity bill in California was $1,710, or 72.0% higher ($716) than the comparable bill in 2010 (the year the AB 32 implementation began with the Early Action items). In this same period, the average US (less CA) electricity bill for all the other states grew only 21.2% ($289).
In 2010, California had the 9th lowest residential electricity bill among the contiguous states and DC. In the latest data, it had the 17th highest.
Residential bills, however, vary widely by region. Transforming the 2022 data recently released by the Energy Commission, estimated annual household usage is as much as 82% higher in the interior regions compared to the milder climate coastal areas, and substantially higher when comparing across counties.
$11.5b Premium Above
Average Price in
Other States
For the 12 months ended January 2024, California's higher electricity prices translated into Residential ratepayers paying $11.5 billion more than the average ratepayers elsewhere in the US using the same amount of energy. Compared to the lowest cost state, California households paid $15.0 billion more.
California Commercial Electricity Price 104.3% Above Average for
Rest of US
California average Commercial Price for the 12 months ended January 2024 was 24.02 cents/kWh, 104.3% higher than the US average of 11.76 cents/kWh for all states other than California. California's commercial prices again were the highest among the contiguous states and DC.
California Industrial Electricity Price 148.7% Above Average for
Rest of US
California average Industrial Price for the 12 months ended January 2024 was 19.00 cents/kWh, 148.7% higher than the US average of 7.64 cents/kWh for all states other than California. California's industrial prices rose to the highest among the contiguous states and DC.
$18.6b Premium Above
Average Price in
Other States
For the 12 months ended January 2024, California's higher electricity prices translated into Commercial & Industrial ratepayers paying $18.6 billion more than ratepayers elsewhere in the US using the same amount of energy. Compared to the lowest rate states, Commercial & Industrial ratepayers paid $23.9 billion more.
California Natural Gas Prices
Average prices ($ per thousand cubic feet; 12-month moving average) for the 12 months ended January 2024 and changes from the previous 12-month period for each end user:
Note: All data sources, methodologies and historical data series available at [[link removed]]
Download Report [[link removed]] The California Center for Jobs and the Economy provides an objective and definitive source of information pertaining to job creation and economic trends in California. [[link removed]] Contact 1301 I Street Sacramento, CA 95814 916.553.4093 If you no longer wish to receive these emails, select here to unsubscribe. [link removed]
Message Analysis
- Sender: California Center for Jobs and the Economy
- Political Party: n/a
- Country: United States
- State/Locality: California
- Office: n/a
-
Email Providers:
- Campaign Monitor