| From | Center for Jobs and the Economy <[email protected]> |
| Subject | California Trade Report for February 2020 |
| Date | April 2, 2020 9:00 PM |
Links have been removed from this email. Learn more in the FAQ.
Links have been removed from this email. Learn more in the FAQ.
Web Version [link removed] | Update Preferences [link removed] [link removed] California Trade Report
for February 2020
Below are highlights from the recently released trade data from the US Census Bureau and US Bureau of Economic Analysis. To view additional data and analysis related to the California economy visit our website at [[link removed]].
The February data begins to capture the sharp downturn in economic activity related to the current COVID-19 emergency. The table below shows the initial effects related to shutdowns in China, with goods trade with China, Hong Kong, and Macau through the state’s ports down 60.2% from the year earlier.
Similarly, goods exports and imports originating in California were down sharply, by 55.8%. For both exports and imports, the numbers incorporate goods produced/used within the state as well as shipments related to other states that are consolidated by the state’s trade-related businesses.
Share of Goods through US Ports 17.3% CA Share of Total Trade Through US Ports
The share of total US goods trade (exports and imports) through California ports continued to fall to 17.31% (12 month moving average; compared to 17.46% in Jan 2020 and 18.09% in Feb 2019).
California remained the #2 state, behind Texas with 17.98% (compared to 17.94% in Jan 2020 and 17.68% in Feb 2019). Trade through the Atlantic port states was at 29.86% (compared to 29.86% in Jan 2020 and 29.38% in Feb 2019).
California Goods Exports Decrease -$0.1 Billion In Exports
In spite of the disruptions coming from China, total California goods exports were down only $0.1 billion from Feb 2019 (down 0.8%). California remained in 2nd place with 10.5% of all US goods exports (12 month moving total), behind Texas at 20.36%.
California's Balance for Goods Trade -$12.4 Billion of Goods Trade
California’s balance of goods trade activity through state businesses narrowed to -$12.4 billion, compared to a level of -$15.2 billion in Feb 2019. California trade accounted for 27% of the US trade deficit in goods in Feb 2020.
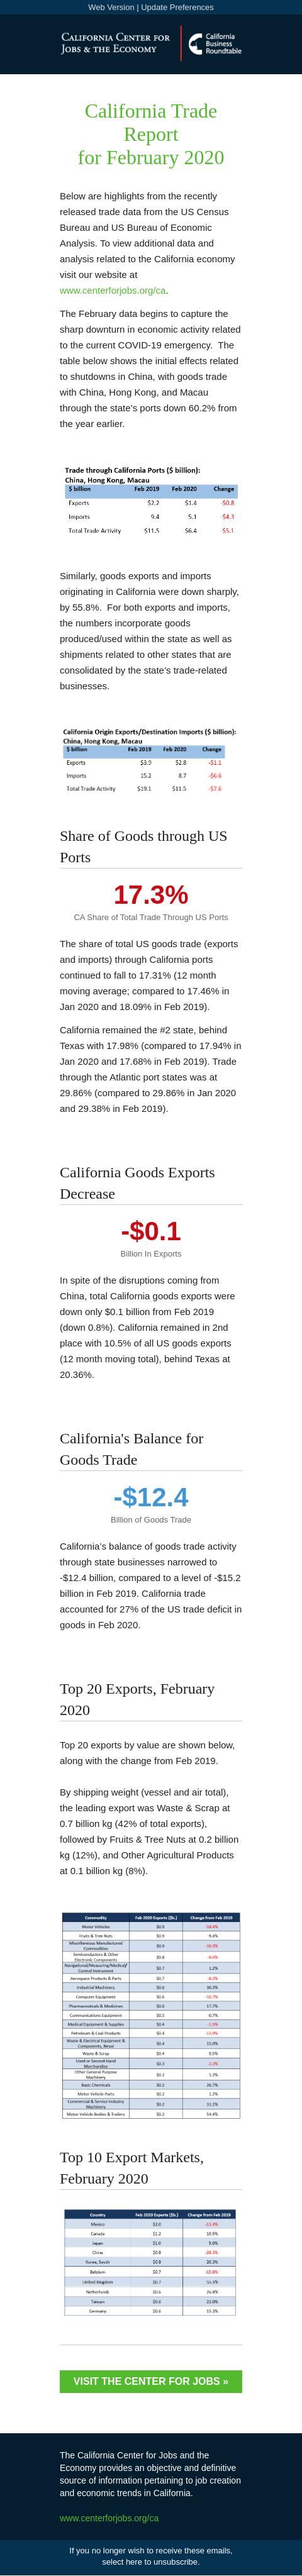
Top 20 Exports, February 2020
Top 20 exports by value are shown below, along with the change from Feb 2019.
By shipping weight (vessel and air total), the leading export was Waste & Scrap at 0.7 billion kg (42% of total exports), followed by Fruits & Tree Nuts at 0.2 billion kg (12%), and Other Agricultural Products at 0.1 billion kg (8%).
Top 10 Export Markets, February 2020 Visit the center for jobs » [[link removed]] The California Center for Jobs and the Economy provides an objective and definitive source of information pertaining to job creation and economic trends in California. [[link removed]] Contact 1301 I Street Sacramento, CA 95814 916.553.4093 If you no longer wish to receive these emails, select here to unsubscribe. [link removed]
for February 2020
Below are highlights from the recently released trade data from the US Census Bureau and US Bureau of Economic Analysis. To view additional data and analysis related to the California economy visit our website at [[link removed]].
The February data begins to capture the sharp downturn in economic activity related to the current COVID-19 emergency. The table below shows the initial effects related to shutdowns in China, with goods trade with China, Hong Kong, and Macau through the state’s ports down 60.2% from the year earlier.
Similarly, goods exports and imports originating in California were down sharply, by 55.8%. For both exports and imports, the numbers incorporate goods produced/used within the state as well as shipments related to other states that are consolidated by the state’s trade-related businesses.
Share of Goods through US Ports 17.3% CA Share of Total Trade Through US Ports
The share of total US goods trade (exports and imports) through California ports continued to fall to 17.31% (12 month moving average; compared to 17.46% in Jan 2020 and 18.09% in Feb 2019).
California remained the #2 state, behind Texas with 17.98% (compared to 17.94% in Jan 2020 and 17.68% in Feb 2019). Trade through the Atlantic port states was at 29.86% (compared to 29.86% in Jan 2020 and 29.38% in Feb 2019).
California Goods Exports Decrease -$0.1 Billion In Exports
In spite of the disruptions coming from China, total California goods exports were down only $0.1 billion from Feb 2019 (down 0.8%). California remained in 2nd place with 10.5% of all US goods exports (12 month moving total), behind Texas at 20.36%.
California's Balance for Goods Trade -$12.4 Billion of Goods Trade
California’s balance of goods trade activity through state businesses narrowed to -$12.4 billion, compared to a level of -$15.2 billion in Feb 2019. California trade accounted for 27% of the US trade deficit in goods in Feb 2020.
Top 20 Exports, February 2020
Top 20 exports by value are shown below, along with the change from Feb 2019.
By shipping weight (vessel and air total), the leading export was Waste & Scrap at 0.7 billion kg (42% of total exports), followed by Fruits & Tree Nuts at 0.2 billion kg (12%), and Other Agricultural Products at 0.1 billion kg (8%).
Top 10 Export Markets, February 2020 Visit the center for jobs » [[link removed]] The California Center for Jobs and the Economy provides an objective and definitive source of information pertaining to job creation and economic trends in California. [[link removed]] Contact 1301 I Street Sacramento, CA 95814 916.553.4093 If you no longer wish to receive these emails, select here to unsubscribe. [link removed]
Message Analysis
- Sender: California Center for Jobs and the Economy
- Political Party: n/a
- Country: United States
- State/Locality: California
- Office: n/a
-
Email Providers:
- Campaign Monitor