Email
NEW: 10 of our most powerful visualizations on mass incarceration, racial disparities, & more
| From | Prison Policy Initiative <[email protected]> |
| Subject | NEW: 10 of our most powerful visualizations on mass incarceration, racial disparities, & more |
| Date | April 2, 2024 2:45 PM |
Links have been removed from this email. Learn more in the FAQ.
Links have been removed from this email. Learn more in the FAQ.
Our most important — and frequently requested — data visualizations.
Prison Policy Initiative updates for April 2, 2024 Exposing how mass incarceration harms communities and our national welfare
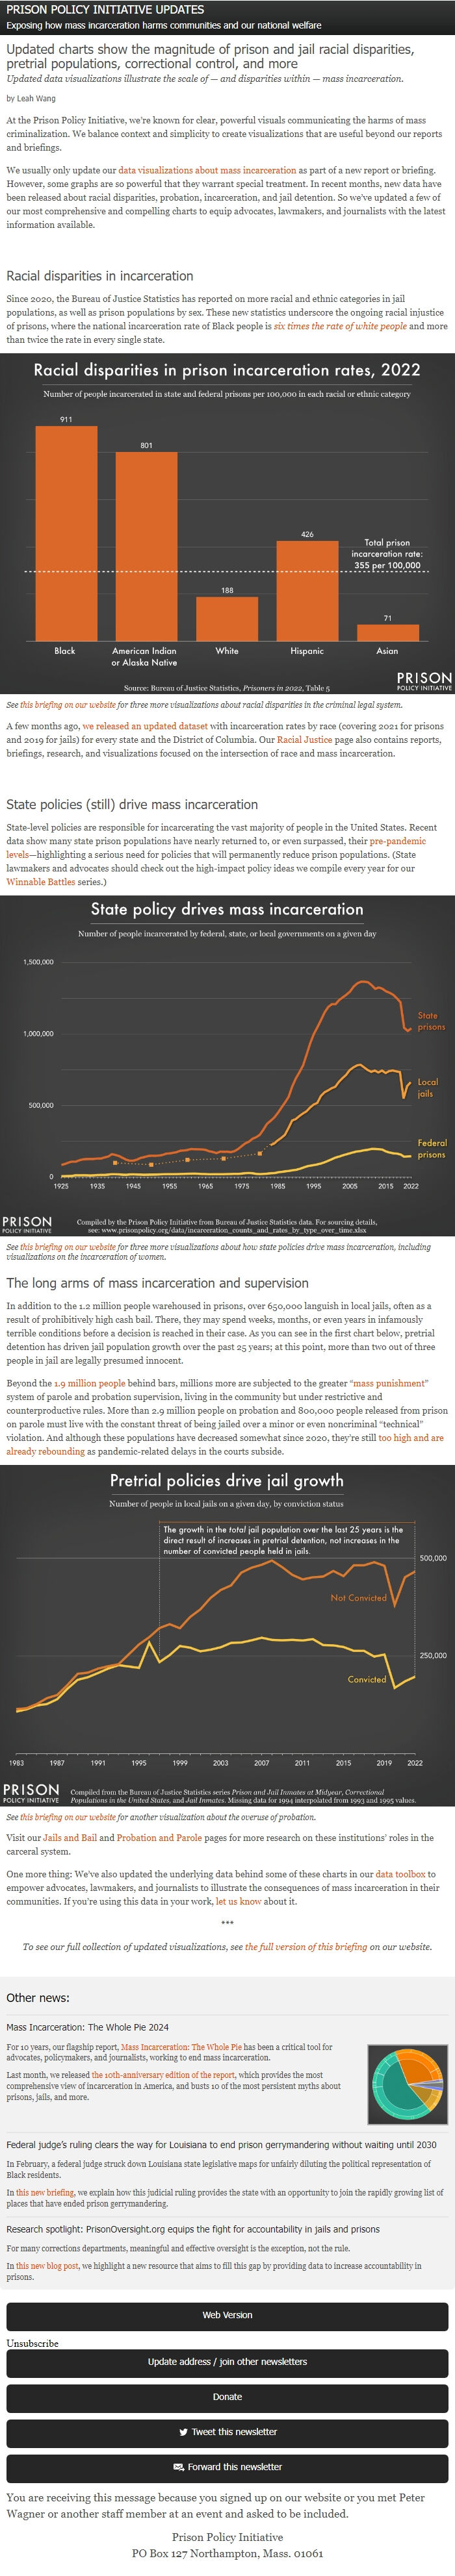
Updated charts show the magnitude of prison and jail racial disparities, pretrial populations, correctional control, and more [[link removed]] Updated data visualizations illustrate the scale of — and disparities within — mass incarceration. [[link removed]]
by Leah Wang
At the Prison Policy Initiative, we’re known for clear, powerful visuals communicating the harms of mass criminalization. We balance context and simplicity to create visualizations that are useful beyond our reports and briefings.
We usually only update our data visualizations about mass incarceration [[link removed]] as part of a new report or briefing. However, some graphs are so powerful that they warrant special treatment. In recent months, new data have been released about racial disparities, probation, incarceration, and jail detention. So we’ve updated a few of our most comprehensive and compelling charts to equip advocates, lawmakers, and journalists with the latest information available.
Racial disparities in incarceration
Since 2020, the Bureau of Justice Statistics has reported on more racial and ethnic categories in jail populations, as well as prison populations by sex. These new statistics underscore the ongoing racial injustice of prisons, where the national incarceration rate of Black people is six times the rate of white people [[link removed]] and more than twice the rate in every single state.
See this briefing on our website [[link removed]] for three more visualizations about racial disparities in the criminal legal system.
A few months ago, we released an updated dataset [[link removed]] with incarceration rates by race (covering 2021 for prisons and 2019 for jails) for every state and the District of Columbia. Our Racial Justice [[link removed]] page also contains reports, briefings, research, and visualizations focused on the intersection of race and mass incarceration.
State policies (still) drive mass incarceration
State-level policies are responsible for incarcerating the vast majority of people in the United States. Recent data show many state prison populations have nearly returned to, or even surpassed, their pre-pandemic levels [[link removed]]—highlighting a serious need for policies that will permanently reduce prison populations. (State lawmakers and advocates should check out the high-impact policy ideas we compile every year for our Winnable Battles [[link removed]] series.)
See this briefing on our website [[link removed]] for three more visualizations about how state policies drive mass incarceration, including visualizations on the incarceration of women.
The long arms of mass incarceration and supervision
In addition to the 1.2 million people warehoused in prisons, over 650,000 languish in local jails, often as a result of prohibitively high cash bail. There, they may spend weeks, months, or even years in infamously terrible conditions before a decision is reached in their case. As you can see in the first chart below, pretrial detention has driven jail population growth over the past 25 years; at this point, more than two out of three people in jail are legally presumed innocent.
Beyond the 1.9 million people [[link removed]] behind bars, millions more are subjected to the greater “ mass punishment [[link removed]]” system of parole and probation supervision, living in the community but under restrictive and counterproductive rules. More than 2.9 million people on probation and 800,000 people released from prison on parole must live with the constant threat of being jailed over a minor or even noncriminal “technical” violation. And although these populations have decreased somewhat since 2020, they’re still too high and are already rebounding [[link removed]] as pandemic-related delays in the courts subside.
See this briefing on our website [[link removed]] for another visualization about the overuse of probation.
Visit our Jails and Bail [[link removed]] and Probation and Parole [[link removed]] pages for more research on these institutions’ roles in the carceral system.
One more thing: We’ve also updated the underlying data behind some of these charts in our data toolbox [[link removed]] to empower advocates, lawmakers, and journalists to illustrate the consequences of mass incarceration in their communities. If you’re using this data in your work, let us know [[link removed]] about it.
***
To see our full collection of updated visualizations, see the full version of this briefing [[link removed]] on our website.
Please support our work [[link removed]]
Our work is made possible by private donations. Can you help us keep going? We can accept tax-deductible gifts online [[link removed]] or via paper checks sent to PO Box 127 Northampton MA 01061. Thank you!
Other news: Mass Incarceration: The Whole Pie 2024 [[link removed]]
For 10 years, our flagship report, Mass Incarceration: The Whole Pie [[link removed]] has been a critical tool for advocates, policymakers, and journalists, working to end mass incarceration.
Last month, we released the 10th-anniversary edition of the report [[link removed]], which provides the most comprehensive view of incarceration in America, and busts 10 of the most persistent myths about prisons, jails, and more.
Federal judge’s ruling clears the way for Louisiana to end prison gerrymandering without waiting until 2030 [[link removed]]
In February, a federal judge struck down Louisiana state legislative maps for unfairly diluting the political representation of Black residents.
In this new briefing [[link removed]], we explain how this judicial ruling provides the state with an opportunity to join the rapidly growing list of places that have ended prison gerrymandering.
Research spotlight: PrisonOversight.org equips the fight for accountability in jails and prisons [[link removed]]
For many corrections departments, meaningful and effective oversight is the exception, not the rule.
In this new blog post [[link removed]], we highlight a new resource that aims to fill this gap by providing data to increase accountability in prisons.
Please support our work [[link removed]]
Our work is made possible by private donations. Can you help us keep going? We can accept tax-deductible gifts online [[link removed]] or via paper checks sent to PO Box 127 Northampton MA 01061. Thank you!
Our other newsletters Ending prison gerrymandering ( archives [[link removed]]) Criminal justice research library ( archives [[link removed]])
Update your newsletter subscriptions [link removed].
You are receiving this message because you signed up on our website [[link removed]] or you met Peter Wagner or another staff member at an event and asked to be included.
Prison Policy Initiative [[link removed]]
PO Box 127
Northampton, Mass. 01061
Web Version [link removed] Unsubscribe [link removed] Update address / join other newsletters [link removed] Donate [[link removed]] Tweet this newsletter [link removed] Forward this newsletter [link removed]
You are receiving this message because you signed up on our website or you met Peter Wagner or another staff member at an event and asked to be included.
Prison Policy Initiative
PO Box 127 Northampton, Mass. 01061
Did someone forward this to you? If you enjoyed reading, please subscribe! [[link removed]] Web Version [link removed] | Update address [link removed] | Unsubscribe [link removed] | Share via: Twitter [link removed] Facebook [[link removed] Email [link removed]
Prison Policy Initiative updates for April 2, 2024 Exposing how mass incarceration harms communities and our national welfare
Updated charts show the magnitude of prison and jail racial disparities, pretrial populations, correctional control, and more [[link removed]] Updated data visualizations illustrate the scale of — and disparities within — mass incarceration. [[link removed]]
by Leah Wang
At the Prison Policy Initiative, we’re known for clear, powerful visuals communicating the harms of mass criminalization. We balance context and simplicity to create visualizations that are useful beyond our reports and briefings.
We usually only update our data visualizations about mass incarceration [[link removed]] as part of a new report or briefing. However, some graphs are so powerful that they warrant special treatment. In recent months, new data have been released about racial disparities, probation, incarceration, and jail detention. So we’ve updated a few of our most comprehensive and compelling charts to equip advocates, lawmakers, and journalists with the latest information available.
Racial disparities in incarceration
Since 2020, the Bureau of Justice Statistics has reported on more racial and ethnic categories in jail populations, as well as prison populations by sex. These new statistics underscore the ongoing racial injustice of prisons, where the national incarceration rate of Black people is six times the rate of white people [[link removed]] and more than twice the rate in every single state.
See this briefing on our website [[link removed]] for three more visualizations about racial disparities in the criminal legal system.
A few months ago, we released an updated dataset [[link removed]] with incarceration rates by race (covering 2021 for prisons and 2019 for jails) for every state and the District of Columbia. Our Racial Justice [[link removed]] page also contains reports, briefings, research, and visualizations focused on the intersection of race and mass incarceration.
State policies (still) drive mass incarceration
State-level policies are responsible for incarcerating the vast majority of people in the United States. Recent data show many state prison populations have nearly returned to, or even surpassed, their pre-pandemic levels [[link removed]]—highlighting a serious need for policies that will permanently reduce prison populations. (State lawmakers and advocates should check out the high-impact policy ideas we compile every year for our Winnable Battles [[link removed]] series.)
See this briefing on our website [[link removed]] for three more visualizations about how state policies drive mass incarceration, including visualizations on the incarceration of women.
The long arms of mass incarceration and supervision
In addition to the 1.2 million people warehoused in prisons, over 650,000 languish in local jails, often as a result of prohibitively high cash bail. There, they may spend weeks, months, or even years in infamously terrible conditions before a decision is reached in their case. As you can see in the first chart below, pretrial detention has driven jail population growth over the past 25 years; at this point, more than two out of three people in jail are legally presumed innocent.
Beyond the 1.9 million people [[link removed]] behind bars, millions more are subjected to the greater “ mass punishment [[link removed]]” system of parole and probation supervision, living in the community but under restrictive and counterproductive rules. More than 2.9 million people on probation and 800,000 people released from prison on parole must live with the constant threat of being jailed over a minor or even noncriminal “technical” violation. And although these populations have decreased somewhat since 2020, they’re still too high and are already rebounding [[link removed]] as pandemic-related delays in the courts subside.
See this briefing on our website [[link removed]] for another visualization about the overuse of probation.
Visit our Jails and Bail [[link removed]] and Probation and Parole [[link removed]] pages for more research on these institutions’ roles in the carceral system.
One more thing: We’ve also updated the underlying data behind some of these charts in our data toolbox [[link removed]] to empower advocates, lawmakers, and journalists to illustrate the consequences of mass incarceration in their communities. If you’re using this data in your work, let us know [[link removed]] about it.
***
To see our full collection of updated visualizations, see the full version of this briefing [[link removed]] on our website.
Please support our work [[link removed]]
Our work is made possible by private donations. Can you help us keep going? We can accept tax-deductible gifts online [[link removed]] or via paper checks sent to PO Box 127 Northampton MA 01061. Thank you!
Other news: Mass Incarceration: The Whole Pie 2024 [[link removed]]
For 10 years, our flagship report, Mass Incarceration: The Whole Pie [[link removed]] has been a critical tool for advocates, policymakers, and journalists, working to end mass incarceration.
Last month, we released the 10th-anniversary edition of the report [[link removed]], which provides the most comprehensive view of incarceration in America, and busts 10 of the most persistent myths about prisons, jails, and more.
Federal judge’s ruling clears the way for Louisiana to end prison gerrymandering without waiting until 2030 [[link removed]]
In February, a federal judge struck down Louisiana state legislative maps for unfairly diluting the political representation of Black residents.
In this new briefing [[link removed]], we explain how this judicial ruling provides the state with an opportunity to join the rapidly growing list of places that have ended prison gerrymandering.
Research spotlight: PrisonOversight.org equips the fight for accountability in jails and prisons [[link removed]]
For many corrections departments, meaningful and effective oversight is the exception, not the rule.
In this new blog post [[link removed]], we highlight a new resource that aims to fill this gap by providing data to increase accountability in prisons.
Please support our work [[link removed]]
Our work is made possible by private donations. Can you help us keep going? We can accept tax-deductible gifts online [[link removed]] or via paper checks sent to PO Box 127 Northampton MA 01061. Thank you!
Our other newsletters Ending prison gerrymandering ( archives [[link removed]]) Criminal justice research library ( archives [[link removed]])
Update your newsletter subscriptions [link removed].
You are receiving this message because you signed up on our website [[link removed]] or you met Peter Wagner or another staff member at an event and asked to be included.
Prison Policy Initiative [[link removed]]
PO Box 127
Northampton, Mass. 01061
Web Version [link removed] Unsubscribe [link removed] Update address / join other newsletters [link removed] Donate [[link removed]] Tweet this newsletter [link removed] Forward this newsletter [link removed]
You are receiving this message because you signed up on our website or you met Peter Wagner or another staff member at an event and asked to be included.
Prison Policy Initiative
PO Box 127 Northampton, Mass. 01061
Did someone forward this to you? If you enjoyed reading, please subscribe! [[link removed]] Web Version [link removed] | Update address [link removed] | Unsubscribe [link removed] | Share via: Twitter [link removed] Facebook [[link removed] Email [link removed]
Message Analysis
- Sender: Prison Policy Initiative
- Political Party: n/a
- Country: United States
- State/Locality: n/a
- Office: n/a
-
Email Providers:
- Campaign Monitor