| From | Center for Jobs and the Economy <[email protected]> |
| Subject | California Trade Report for September 2023 |
| Date | November 7, 2023 9:30 PM |
Links have been removed from this email. Learn more in the FAQ.
Links have been removed from this email. Learn more in the FAQ.
Web Version [link removed] | Update Preferences [link removed] [link removed] California Trade Report
for September 2023
Below are highlights from the recently released trade data from the US Census Bureau and US Bureau of Economic Analysis. To view additional data and analysis related to the California economy visit our website at [[link removed]].
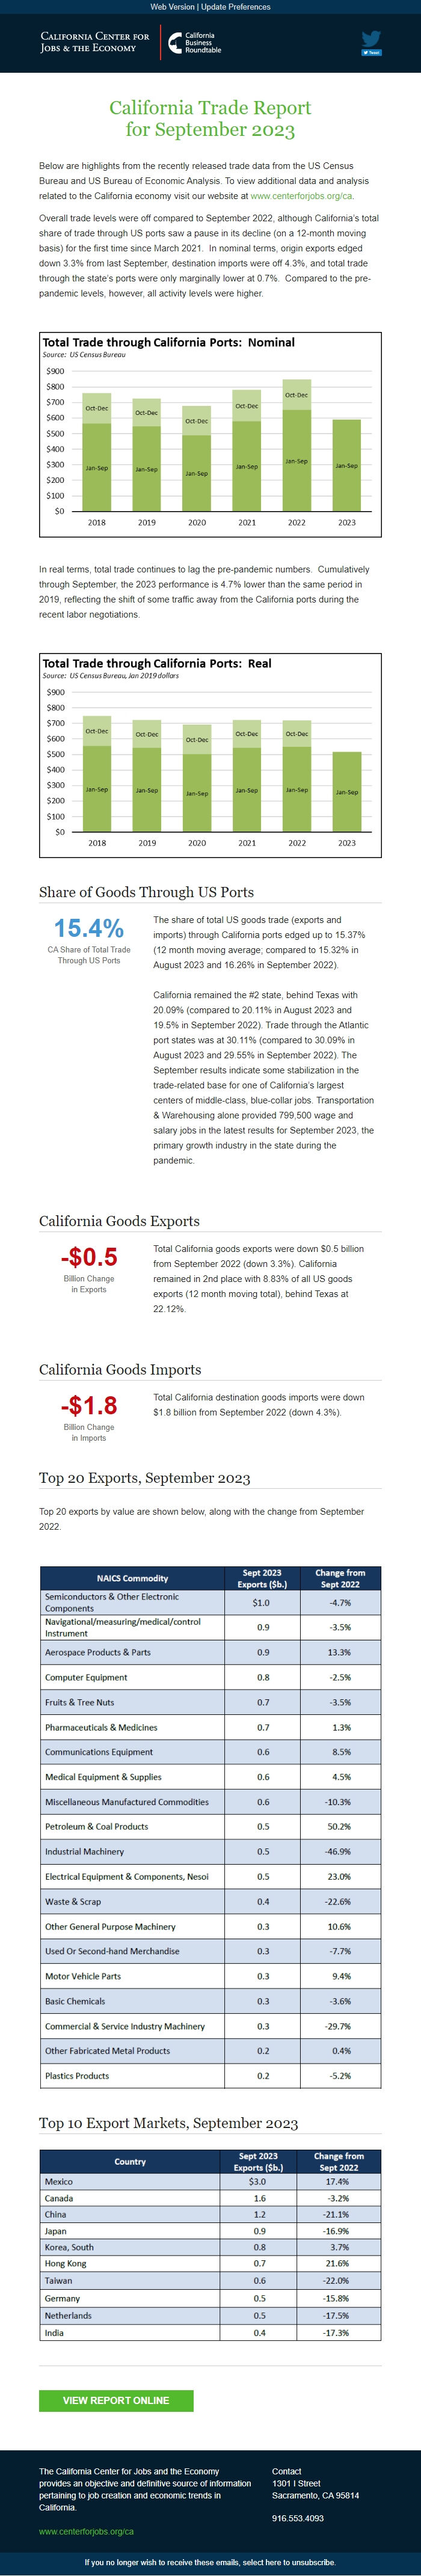
Overall trade levels were off compared to September 2022, although California’s total share of trade through US ports saw a pause in its decline (on a 12-month moving basis) for the first time since March 2021. In nominal terms, origin exports edged down 3.3% from last September, destination imports were off 4.3%, and total trade through the state’s ports were only marginally lower at 0.7%. Compared to the pre-pandemic levels, however, all activity levels were higher.
In real terms, total trade continues to lag the pre-pandemic numbers. Cumulatively through September, the 2023 performance is 4.7% lower than the same period in 2019, reflecting the shift of some traffic away from the California ports during the recent labor negotiations.
Share of Goods Through US Ports 15.4% CA Share of Total Trade
Through US Ports
The share of total US goods trade (exports and imports) through California ports edged up to 15.37% (12 month moving average; compared to 15.32% in August 2023 and 16.26% in September 2022).
California remained the #2 state, behind Texas with 20.09% (compared to 20.11% in August 2023 and 19.5% in September 2022). Trade through the Atlantic port states was at 30.11% (compared to 30.09% in August 2023 and 29.55% in September 2022). The September results indicate some stabilization in the trade-related base for one of California’s largest centers of middle-class, blue-collar jobs. Transportation & Warehousing alone provided 799,500 wage and salary jobs in the latest results for September 2023, the primary growth industry in the state during the pandemic.
California Goods Exports -$0.5 Billion Change
in Exports
Total California goods exports were down $0.5 billion from September 2022 (down 3.3%). California remained in 2nd place with 8.83% of all US goods exports (12 month moving total), behind Texas at 22.12%.
California Goods Imports -$1.8 Billion Change
in Imports
Total California destination goods imports were down $1.8 billion from September 2022 (down 4.3%).
Top 20 Exports, September 2023
Top 20 exports by value are shown below, along with the change from September 2022.
Top 10 Export Markets, September 2023 View Report Online [[link removed]] The California Center for Jobs and the Economy provides an objective and definitive source of information pertaining to job creation and economic trends in California. [[link removed]] Contact 1301 I Street Sacramento, CA 95814 916.553.4093 If you no longer wish to receive these emails, select here to unsubscribe. [link removed]
for September 2023
Below are highlights from the recently released trade data from the US Census Bureau and US Bureau of Economic Analysis. To view additional data and analysis related to the California economy visit our website at [[link removed]].
Overall trade levels were off compared to September 2022, although California’s total share of trade through US ports saw a pause in its decline (on a 12-month moving basis) for the first time since March 2021. In nominal terms, origin exports edged down 3.3% from last September, destination imports were off 4.3%, and total trade through the state’s ports were only marginally lower at 0.7%. Compared to the pre-pandemic levels, however, all activity levels were higher.
In real terms, total trade continues to lag the pre-pandemic numbers. Cumulatively through September, the 2023 performance is 4.7% lower than the same period in 2019, reflecting the shift of some traffic away from the California ports during the recent labor negotiations.
Share of Goods Through US Ports 15.4% CA Share of Total Trade
Through US Ports
The share of total US goods trade (exports and imports) through California ports edged up to 15.37% (12 month moving average; compared to 15.32% in August 2023 and 16.26% in September 2022).
California remained the #2 state, behind Texas with 20.09% (compared to 20.11% in August 2023 and 19.5% in September 2022). Trade through the Atlantic port states was at 30.11% (compared to 30.09% in August 2023 and 29.55% in September 2022). The September results indicate some stabilization in the trade-related base for one of California’s largest centers of middle-class, blue-collar jobs. Transportation & Warehousing alone provided 799,500 wage and salary jobs in the latest results for September 2023, the primary growth industry in the state during the pandemic.
California Goods Exports -$0.5 Billion Change
in Exports
Total California goods exports were down $0.5 billion from September 2022 (down 3.3%). California remained in 2nd place with 8.83% of all US goods exports (12 month moving total), behind Texas at 22.12%.
California Goods Imports -$1.8 Billion Change
in Imports
Total California destination goods imports were down $1.8 billion from September 2022 (down 4.3%).
Top 20 Exports, September 2023
Top 20 exports by value are shown below, along with the change from September 2022.
Top 10 Export Markets, September 2023 View Report Online [[link removed]] The California Center for Jobs and the Economy provides an objective and definitive source of information pertaining to job creation and economic trends in California. [[link removed]] Contact 1301 I Street Sacramento, CA 95814 916.553.4093 If you no longer wish to receive these emails, select here to unsubscribe. [link removed]
Message Analysis
- Sender: California Center for Jobs and the Economy
- Political Party: n/a
- Country: United States
- State/Locality: California
- Office: n/a
-
Email Providers:
- Campaign Monitor