| From | Center for Jobs and the Economy <[email protected]> |
| Subject | California Trade Report for June 2019 |
| Date | August 2, 2019 10:00 PM |
Links have been removed from this email. Learn more in the FAQ.
Links have been removed from this email. Learn more in the FAQ.
Web Version [link removed] | Update Preferences [link removed] [link removed] California Trade Report
for June 2019
Below are highlights from the recently released trade data from the US Census Bureau and US Bureau of Economic Analysis. To view additional data and analysis related to the California economy visit our website at [[link removed]].
Share of Goods through US Ports 17.9% CA Share of Total Trade Through US Ports
Total US goods trade (exports and imports) through California ports edged down to 17.94% (12 month moving average; compared to 17.97% in May 2019 and 18.33% in Jun 2018).
California remained the #1 state, ahead of Texas with 17.74% (compared to 17.72% in May 2019 and 17.14% in June 2018). Trade through the Atlantic port states was at 29.55% (compared to 29.53% in May 2019 and 29.45% in June 2018). The state’s continued lead in this area forms the trade-related base for one of California’s largest centers of middle-class, blue-collar jobs. Transportation & Warehousing alone provided 618,000 jobs in June (up from 601,900 in Jun 2018), paying an average annual salary of $63.5k. This employment base in turn supports additional blue-collar and white-collar jobs in a range of other industries.
California Goods Export Decrease -$1.4 Billion in Exports
Total California goods exports were down sharply by $1.4 billion from Jun 2018 (down 8.9%), as the June numbers tracked more with July’s in prior years. California remained in 2nd place with 10.58% of all US goods exports (12 month moving total), behind Texas at 19.52%.
California Balance for Goods Trade -$21.4 Balance of Goods Trade
California’s balance of goods trade through state businesses broadened to -$21.4 billion, compared to a level of -$20.0 billion in June 2018. California trade accounted for 31% of the US trade deficit in goods in June 2019.
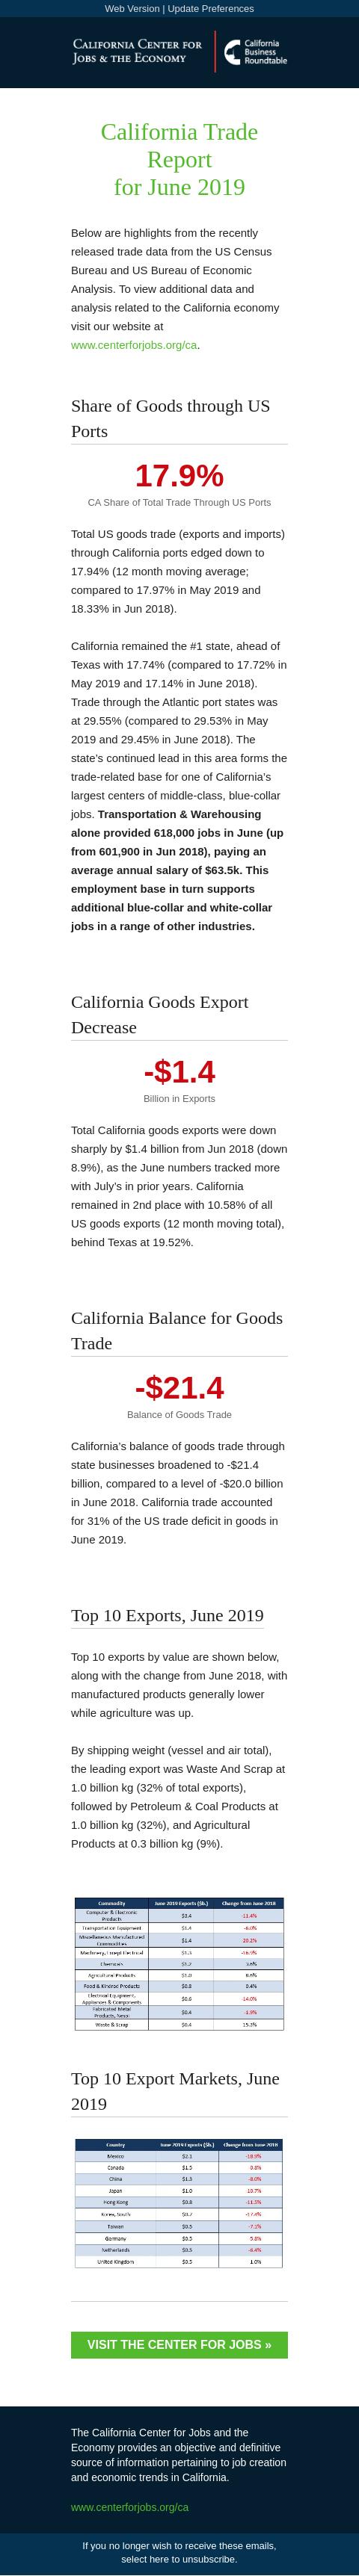
Top 10 Exports, June 2019
Top 10 exports by value are shown below, along with the change from June 2018, with manufactured products generally lower while agriculture was up.
By shipping weight (vessel and air total), the leading export was Waste And Scrap at 1.0 billion kg (32% of total exports), followed by Petroleum & Coal Products at 1.0 billion kg (32%), and Agricultural Products at 0.3 billion kg (9%).
Top 10 Export Markets, June 2019 Visit the center for jobs » [[link removed]] The California Center for Jobs and the Economy provides an objective and definitive source of information pertaining to job creation and economic trends in California. [[link removed]] Contact 1301 I Street Sacramento, CA 95814 916.553.4093 If you no longer wish to receive these emails, select here to unsubscribe. [link removed]
for June 2019
Below are highlights from the recently released trade data from the US Census Bureau and US Bureau of Economic Analysis. To view additional data and analysis related to the California economy visit our website at [[link removed]].
Share of Goods through US Ports 17.9% CA Share of Total Trade Through US Ports
Total US goods trade (exports and imports) through California ports edged down to 17.94% (12 month moving average; compared to 17.97% in May 2019 and 18.33% in Jun 2018).
California remained the #1 state, ahead of Texas with 17.74% (compared to 17.72% in May 2019 and 17.14% in June 2018). Trade through the Atlantic port states was at 29.55% (compared to 29.53% in May 2019 and 29.45% in June 2018). The state’s continued lead in this area forms the trade-related base for one of California’s largest centers of middle-class, blue-collar jobs. Transportation & Warehousing alone provided 618,000 jobs in June (up from 601,900 in Jun 2018), paying an average annual salary of $63.5k. This employment base in turn supports additional blue-collar and white-collar jobs in a range of other industries.
California Goods Export Decrease -$1.4 Billion in Exports
Total California goods exports were down sharply by $1.4 billion from Jun 2018 (down 8.9%), as the June numbers tracked more with July’s in prior years. California remained in 2nd place with 10.58% of all US goods exports (12 month moving total), behind Texas at 19.52%.
California Balance for Goods Trade -$21.4 Balance of Goods Trade
California’s balance of goods trade through state businesses broadened to -$21.4 billion, compared to a level of -$20.0 billion in June 2018. California trade accounted for 31% of the US trade deficit in goods in June 2019.
Top 10 Exports, June 2019
Top 10 exports by value are shown below, along with the change from June 2018, with manufactured products generally lower while agriculture was up.
By shipping weight (vessel and air total), the leading export was Waste And Scrap at 1.0 billion kg (32% of total exports), followed by Petroleum & Coal Products at 1.0 billion kg (32%), and Agricultural Products at 0.3 billion kg (9%).
Top 10 Export Markets, June 2019 Visit the center for jobs » [[link removed]] The California Center for Jobs and the Economy provides an objective and definitive source of information pertaining to job creation and economic trends in California. [[link removed]] Contact 1301 I Street Sacramento, CA 95814 916.553.4093 If you no longer wish to receive these emails, select here to unsubscribe. [link removed]
Message Analysis
- Sender: California Center for Jobs and the Economy
- Political Party: n/a
- Country: United States
- State/Locality: California
- Office: n/a
-
Email Providers:
- Campaign Monitor